Clayton Christensen, who sadly passed away in January last year, pioneered the fields of management and innovation.
His book, The Innovator’s Dilemma, was called one of the six most important business books ever written by The Economist. Andy Grove, then the chief executive of Intel, said a year after its publication that it was the most important book he had read in 10 years. In 2011, Forbes called Clayton one of the most influential business theorists of the last 50 years.
Now, why is Clayton Christensen important for our discussion of return on invested capital, or ROIC?
I’ll tell you.
In the June 2014 issue of Harvard Business Review, Clayton wrote together with Derek van Bever an article titled The Capitalist’s Dilemma. It was essentially an explanation and proposed solution to what was a sluggish U.S. economy sixty months after the 2008 recession ended, producing disappointing growth and job numbers. The main argument was that corporations, despite being flush in cash, failed to invest in innovation that might foster growth.
Since that article was written, there’s been a lot of debate whether Clayton’s dilemma was even true or not. But, Clayton did write something really important about financial metrics:
Because they were taught to believe that the efficiency of capital was a virtue, financiers began measuring profitability not as dollars, yen, or yuan, but as ratios like RONA (return on net assets), ROIC (return on invested capital), and IRR (internal rate of return). These ratios are simply fractions, comprising a numerator and a denominator, but they gave investors and managers twice the number of levers to pull to improve their measured performance.
To drive RONA or ROIC up, they could generate more profit to add to the numerator, of course. But if that seemed daunting, they could focus on reducing the denominator—outsourcing more, wiping more assets off the balance sheet. Either way, the ratio would improve. Similarly, they could increase IRR either by generating more profit to grow the numerator or by reducing the denominator—which is essentially the time required to get the return. If they invested only in projects that paid off quickly, then IRR would go up.
What Clayton clarified here is vital to understand before heading into fundamental analysis of how a company effectively utilizes its capital for current and future investments.
Why? Because ratios and financial metrics tell us just exactly what they claim to tell us: The return on assets is…the return on assets; the profit margin is…the profit margin; the return on invested capital is…the return on invested capital. The actual problem is in how the ratios are understood and applied.
For business managers, it’s very easy to feel pressure to maximize these returns in the short term leading to underinvestment in future growth. And for investors, It’s today very easy to instantly, but mindlessly, look up an estimate of any of these financial metrics in some online database.
Simplistic and easily accessible data points tend to stymie capable people when they don’t understand what surrounds them and why. Return on invested capital is very interesting in this regard because it’s a widely misunderstood metric. You will understand why in a few minutes.
Essentially, like most ratios, return on invested capital consists of a numerator and denominator. And when there are multiple levers to be pulled, there are people to be fooled.
The bold attempt of this Junto note is to make sure that this will not be the case for you if you stick to the end.
Let’s begin. Our discussion will take the following form:
- Definition of Return on Invested Capital
- The Return on Invested Capital Formula
- Why Return on Invested Capital Is Important
- Misconceptions About Return on Invested Capital
- Return on Invested Capital Calculation – the Right Way
- Much Needed Accounting Adjustments
- Conclusion
Definition of Return on Invested Capital
Return on invested capital is a measure of capital efficiency that tells the analyst whether the management of a business is deploying its resources intelligently.
The easy way to understand it is through Warren Buffett’s $1 test that he came up with in his 1984 letters to shareholders:
We feel noble intentions should be checked periodically against results. We test the wisdom of retaining earnings by assessing whether retention, over time, delivers shareholders at least $1 of market value for each $1 retained.
Unrestricted earnings should be retained only where there is a reasonable prospect – backed preferably by historical evidence or, when appropriate by a thoughtful analysis of the future – that for every dollar retained by the corporation, at least one dollar of market value will be created for owners. This will happen only if the capital retained produces incremental earnings equal to, or above, those generally available to investors.
What “generally available to investors” means is essentially the opportunity cost of capital. A business only passes the $1 test if it earns a return on its investments in excess of its cost of capital.
What kinds of investments are we talking about? All kinds of them. Every business must continuously make capital allocation decisions to maximize returns for shareholders. Whether it invests in machinery, equipment, property, securities, or research and development, the business must make comparisons of the returns it will be able to generate when it allocates the capital.
To simplify: If a company invests $1000 in some equipment at the cost of capital of 10%, which in turn generates $70 in after-tax earnings into perpetuity, it would have a market value of only $700 ($70/.10). The investment in new equipment would then fail the $1 test since one dollar invested turns into less than one dollar’s worth. Earnings of $120 dollars create the value of $1200 ($120/.10), hence passing the $1 test.
Return on invested capital is basically the aggregate return measure of all the investments the company makes and has on its books. As the company announces investments such as acquisitions or capital expenditures, the market renders its judgment as to whether the investments add or detract from value. If the company is believed to generate returns on invested capital in excess of the cost of capital, the company should generally be priced at a premium to book value. If the company continuously makes investments that earn returns below the cost of capital, it destroys value and generally deserves a discount to book value.
The Return on Invested Capital Formula
The formula for return on invested capital is as follows:
Return on Invested Capital = NOPAT / Invested Capital
Notice that neither the numerator nor denominator of the formula are standard measures, meaning we won’t find them on any standard financial statement. We have to figure them out ourselves. This is where fundamental analysis comes in handy.
We will dig into the details of the formula in a few minutes, but for now, it’s just important to understand what the two measures mean.
The first part of the formula, the numerator, consists of net operating income after tax (NOPAT) rather than net income. NOPAT is a company’s potential cash earnings on an unlevered basis. Thus, NOPAT is the same whether a company is highly levered or free of debt. It’s an essential factor for comparability.
NOPAT is an important figure in finance. It’s the number from which we subtract investments (change in net working capital, net capital expenditures, and net M&A) to estimate free cash flow in a discounted cash flow model. It’s the number from which we subtract the absolute cost of capital (capital charge) to calculate economic profit. And, it’s the number that serves as the numerator of ROIC.
The second part of the formula, the denominator, consists of invested capital. Invested capital can be looked at in two equal ways which dual-entry accounting makes sure of. First, it’s the net assets required to run the business. Alternatively, it’s the amount of financing a company’s creditors and shareholders need to supply to fund these net assets. The first way is the most important to look at because it shows how efficiently the company is using capital.
Note that return on invested capital uses book value for invested capital, rather than market values.
Why? The reason is simple.
Our purpose is to calculate the return earned on the capital invested in existing assets and we are assuming that the book values of debt and equity effectively measure these investments. If we were to use the market value of equity, we would mark up the value of existing assets to reflect the market’s perception of their earning power. In other words, the calculation of return on invested capital would give the unsurprising result equal to the market’s cost of capital.
Why Return on Invested Capital Is Important
Before we get to that, let’s first go through why capital allocation itself is important.
As we already established, capital allocation involves apportioning a company’s resources to generate long-term returns in excess of the cost of capital. You – as an investor – know all too well that capital allocation is the name of the game. An investment brings you no value unless it matches or exceeds your required rate of return.
In fact, all CEOs are both capital allocators and investors. And therefore, all roads to managerial evaluation lead to capital allocation. It’s arguably management’s most important responsibility together with allocating employees to do the right jobs. But the truth is that only few companies in the world have excellent capital allocators at their helms. This can turn out to be a real problem because a management’s capital allocation skills have a huge impact on the business’ value over time while the subsequent problem is that how they perform is rarely immediate and obvious.
Most companies are run by excellent managers who alone are enough to generate meaningful profits, which shareholders would find forgiving enough as long as the reinvestment returns in current operations turn out satisfactory. This includes companies that are early in their life cycle. In the early phase, allocating capital has few options – most of the cash flows are poured back into the growing company, and there is typically limited cash to deploy. But once cash is accumulated and once management ventures out to diversify the business in other areas, engage in mergers and acquisitions, or buy back shares in the market, the job quickly turns mighty difficult.
A huge number of studies made on M&A activities come to the same conclusion that most acquisitions destroy value for the acquirer and the ones that do add little value.
To get an idea of its importance, think about the following example: If a company has a CEO for ten years and every year retains earnings amounting to 10% of the company’s net worth, that CEO will have been responsible for allocating more than 60% of all the capital to be deployed during their tenure. You would imagine how much more important the CEO’s capital allocation skills are than their charismatic appeal for the long-term returns of shareholders.
Buffett accentuates the point in his 1987 and 1988 annual letters to shareholders:
The heads of many companies are not skilled in capital allocation. Their inadequacy is not surprising. Most bosses rise to the top because they have excelled in an area such as marketing, production, engineering, administration or, sometimes, institutional politics. Once they become CEOs, they face new responsibilities. They now must make capital allocation decisions, a critical job that they may have never tackled and that is not easily mastered.
[…] CEOs who recognize their lack of capital-allocation skills (which not all do) will often try to compensate by turning to their staffs, management consultants, or investment bankers. Charlie and I have frequently observed the consequences of such “help.” On balance, we feel it’s more likely to accentuate the capital-allocation problem than to solve it. In the end, plenty of unintelligent capital allocation takes place in corporate America. (That’s why you hear so much about “restructuring.”)
Three main choices are available for allocating capital, whether raised or retained through operations:
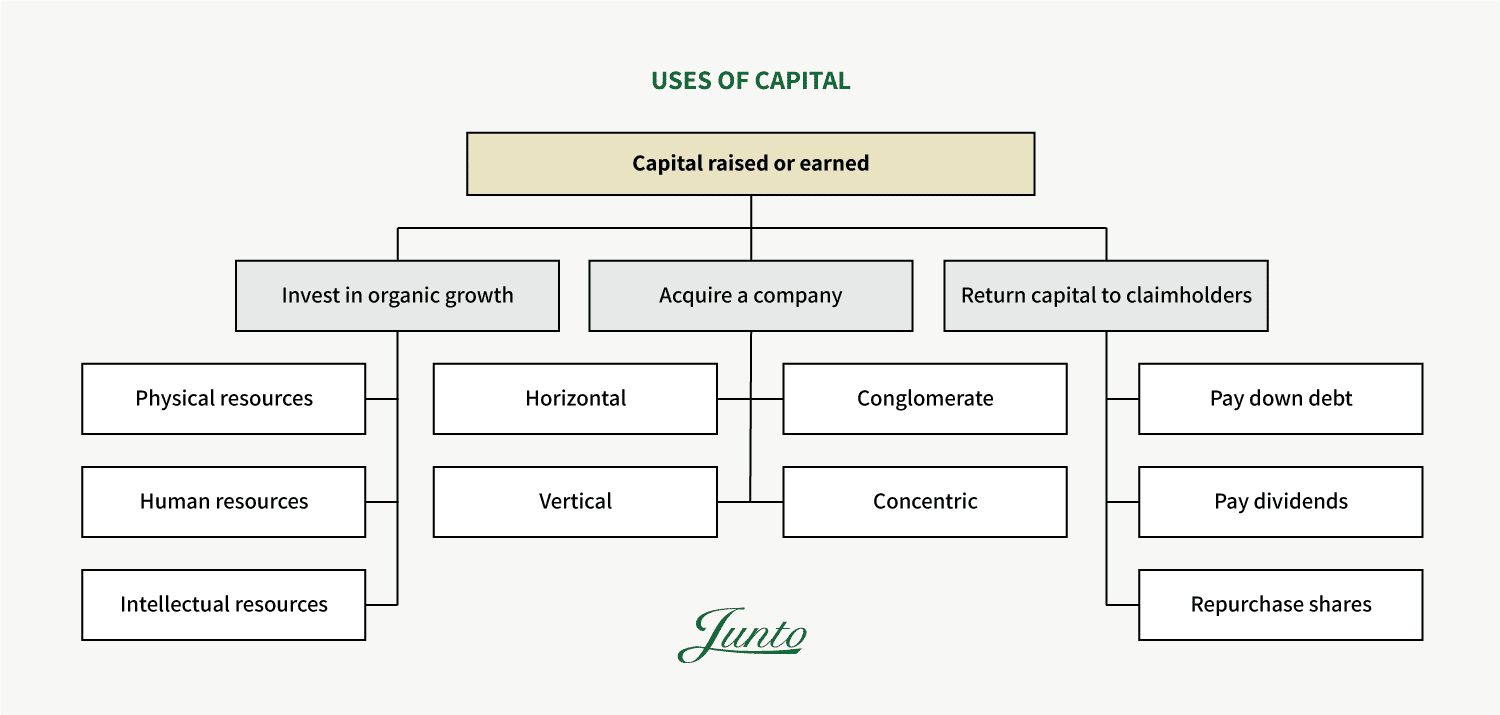
Recall Buffett’s $1 dollar test. If a business is able to deploy its capital and generate a return in excess of its cost of capital, it would avoid using the third option of returning capital to claimholders.
However, that requires an “unless” – a big unless. Because although many strategic actions are based on projections – sometimes stretched far ahead into the future based on arcane budgeting methods – they will always be uncertain to some extent. Sometimes, they’re leaps of faith into the unknown.
But occasionally, there’s a capital allocation option that is much more certain than that, which is when a company’s own stock is selling far below intrinsic value in the market. When great businesses with comfortable financial cushions find such an opportunity, pretty much no alternative action can benefit shareholders as certainly as share repurchases.
Judging Capital Allocation Skills
Now, how does one evaluate the capital allocation skills of management? The obvious answer is to carefully study past capital allocation choices which are what a big part of the rest of this Junto note is all about. But we can’t stop there. For a valuation to be thoughtful, it’s imperative to make judgments about industry structure and competitive advantage in order to assess how those returns might change in the future.
The intelligent investor would ask questions like: How and where is the capital invested? Might current returns be based on short-term asset stripping or write-offs? Are the returns satisfactory and sustainable? Does it have a moat? Will the competitive environment change in the future and will these changes have to be incorporated into forecasts of future returns?
As a ratio, return on invested capital, and its components, does a better job of explaining these questions and changes in shareholder value than any other metric. It gives the clearest picture of exactly how efficiently a company is using its capital, and whether or not its competitive positioning allows it to generate solid returns from that capital. In fact, The Wall Street Journal in 2016 declared ROIC “The Hottest Metric in Finance”.
Furthermore, return on invested capital is directly interlinked with the stable growth of a company. By stable, I mean the rate by which a company can grow without taking on proportionately more debt. The reason is that growth is never free. To grow, almost any company has to reinvest. Hence, the stable reinvestment rate can simply be stated as the simple following function:
Reinvestment Rate = g / ROIC
A company that earns a return on invested capital of 10% and wants to grow by 10% would have to reinvest 100% of every dollar they earn. They won’t have any excess cash to buy back stock, pay dividends, or acquire other companies. A company that grows by 4% and earns a 10% return on invested capital would have to reinvest 40%.
If you think about a discounted cash flow valuation, you can now quickly gauge why return on invested capital becomes the key input that determines a company’s terminal value. In fact, it becomes so important that if you invest in a company with outstanding marginal returns on invested capital and hold it for many years, whether you buy that investment at a discount or premium becomes quite insignificant. Math makes sure that your return will go towards the internal return which underlies the business.
Other metrics of capital efficiency include return on equity (ROE) and return on assets (ROA). But while both are much easier to calculate, they are both inferior measures.
Return on equity is inferior because it’s subject to financial engineering, especially through debt leverage, which can obscure the fundamentals of a business. Additionally, while invested capital is much more frequently a positive number, there are a certain number of companies with negative book values for equity. When this happens, the return on equity becomes a meaningless number.
Return on assets is inferior because of inconsistencies between the numerator and denominator in the ratio. And it can’t be compared to the cost of capital since that cost is based on the cost of debt and equity.
We’re now ready to dive into how to properly calculate return on invested capital. Well, almost. Because, before we get to know the right way, we need to know how one might go wrong.
Misconceptions About Return on Invested Capital
In order to properly use return on invested capital as an assessment of value creation within any business, it’s enormously important to not misuse it and to clearly understand its limitations. If not, one would be the one-legged man in an ass-kicking contest.
Here are just a few situations in which (a lot of) people often go wrong with using return on invested capital.
Misconception 1: They miscalculate it and fail to understand its components.
Here are different estimates of return on invested capital for PepsiCo, Inc. by a few different data sources pulled online:
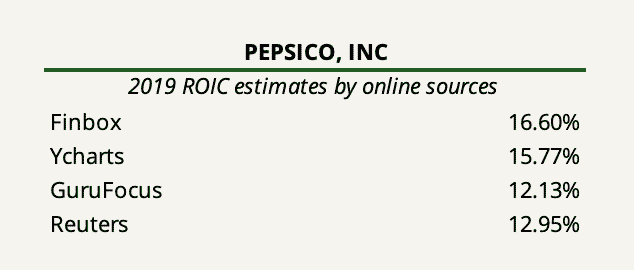
Basically, no data source computes the same figure. Of course, they can’t all be correct.
Now, what does this tell you? It tells that there’s not a single standardized way to compute the exact NOPAT and invested capital figures. But some are much more right than others.
Although the formula for return on invested capital is conceptually straightforward, there is a host of practical matters to consider when doing the calculation which we will go through in the next section. Standardized data sources, unfortunately, do not go through these considerations. It requires fundamental analysis using good judgment.
This issue requires a little story taken from Forbes:
Back in the mid-90’s, ROIC-based models such as Economic Value Added (EVA) and Cash Flow Return On Investment (CFROI) were all the rage, with corporate giants such as Coca-Cola (KO), AT&T (T), and Procter & Gamble (PG) linking them to executive compensation and highlighting them in communications with shareholders.
Fierce competition ensued, as a variety of consultants developed and marketed their own shareholder value models, all, at their core, based around the idea that companies need to earn a return on capital above their cost of capital.
That revolution was short-lived. Coca-Cola and AT&T stopped regularly highlighting EVA in filings after 1998. Some of the consulting companies mentioned in the CFO piece no longer exist, such as Finegan & Gressle, while others like The Boston Consulting Group no longer highlight the same metrics.
[…] The lack of resources and technology available at the time required the proponents of these metrics to do many hours of manual work to provide the metrics for the client and its comp group. As a result, the firms wanted to differentiate their models or build barriers to entry around them so that competitors could not piggyback on their original work.
Transparency was not in the consultants’ best interests. If everyone could see the inner workings of their formulas, clients wouldn’t have any incentive to pay big money for their model over a competitor’s. As a result, the various firms guarded their models and would attack a competitor’s formula as a “consultant’s concoction.”
[…] In the intervening years, the burgeoning financial punditry has helped propagate the myth that the market only cares about reported earnings. The rise of the E*Trade baby and amateur investors only furthered the focus on simplistic data points that could be easily calculated and consumed. More sophisticated fundamental research became harder and harder to find.
Today, there is a noticeable gap for the many investors out there that want high-quality fundamental research. Most of the available research out there doesn’t attempt to assess the true drivers of value.
Today, research and consulting services that deep dive into value-added models as a service include firms such as New Constructs, Credit Suisse (HOLT database), and EVA Dimensions, but they are few and far between. Most simply don’t move below the line of a company’s financial statements and dive into the footnotes. Most don’t do the work required to get a true sense of reality about a company’s value creation.
To gain a fundamental edge as an investor, it’s really about doing the job yourself. And it’s about doing the job right.
Misconception 2: They fail to account for timing differences.
A lot of calculations made for return on invested capital – or any other return-based ratio – take the current year’s NOPAT number and divide it by the invested capital also from the current year’s end. Others prefer to use the average of the invested capital during the year as the base, calculated by averaging the capital invested at the beginning and end of the year.
The first way is wrong. The second way is arguably wrong.
Say we buy a stock for $100 at the beginning of a period which rises to $150 by the end of the period. The calculation of our return would be 50%. By this same reasoning, it only makes sense to use invested capital at the start of the period for computing the company’s true return on the capital invested.
Using average figures is not entirely wrong since investments made to generate income is not fixed during the year. However, this would only make real sense if we follow a mid-year convention for income and cash flows.
Misconception 3: They fail to recognize that it’s based on accounting earnings.
Like most of the information that investors work with in valuation and corporate finance, key figures come from accounting statements. Return on invested capital is no different and the analysis is only useful if the accounting provides a fair view of reality.
As investors, our job is to assess whether the operating income in the most recent year acts as a good proxy of the typical operating earnings on existing investments and whether the book value in fact captures the capital invested in these investments. There are a bunch of factors that may lead one to be skeptical of this assessment. One includes the fact that the use of book value of equity or capital leaves the return exposed to accounting choices made not only in the current period but to choices made over time. For example, a restructuring charge taken 10 years ago can result in a lower book value of equity and a higher return on capital for the most recent year.
Here are just a few other examples of accounting technicals that may produce a distortion of reality: hidden expenses, unrecorded goodwill, changes in accounting rules, derivative exposure and valuation assumptions, pension assumptions, employee stock options, minority interests, and more.
In short, both profits reported and assets booked are products of the art of finance. If a company’s accrual accounting is bonkers, the calculation of return on invested capital renders useless. The intelligent investor will know the practical usefulness (or uselessness) of each ROIC number computed and make the appropriate adjustments – more on that in a minute.
Misconception 4: They fail to recognize that the absolute spread between ROIC and the cost of capital doesn’t give a full picture of the prospects for value creation.
Return on invested capital tells us what it’s supposed to tell us: It shows the return the company made on the capital it invested. It says nothing about how much capital the company can ultimately deploy at the given spread from its cost of capital. But, this is in fact the more important question. Two companies that generate the same positive spread of ROIC to cost of capital will not have the same intrinsic value if one of them can grow faster while maintaining the spread.
Additionally, the ultimate outcomes from capital allocation choices are rarely immediate or obvious. Remember the lesson from Clayton Christensen at the beginning of this Junto note. A company can show a high return on invested capital today by refusing to make the necessary investments required to maintain its core operations and competitive advantage. Or, it can invest sizable amounts of capital in order to innovate and to strengthen its future moat, but possibly suppressing its return on invested capital today. There’s an enormous distinction in the long run here. And for the investor, it’s an impossible thing to gauge what the reality is if one doesn’t understand its moat and level of innovation to begin with. If that’s the case, return on invested capital as a measure becomes worthless.
As a well-known problem, business schools tend to treat finance and competitive strategy as distinct departments. But the two are very much intersected. A thoughtful valuation requires an understanding of industry structure and competitive advantage while a strategy must pass the $1 test to create value. This is probably the most important point in this discussion.
Return on Invested Capital Calculation – the Right Way
Now that you understand what return on invested capital is, why it’s a very important financial measure for assessing the value of a business, and what misconceptions and limitations it surrounds, it’s time to uncover how one should go about calculating it.
Remember, the key to thinking through all the practical matters that follow in this section is to use good judgment and common sense.
Let’s recall the formula for return on invested capital.
Return on Invested Capital = NOPAT / Invested Capital
We’ll continue using PepsiCo as our case study. PepsiCo has relatively straightforward financial statements. First, we’ll do the calculation for the last five fiscal years. Thereafter, we’ll discuss all the measurement issues that may arrive along with consequential fixes that should be made – not just for PepsiCo, but any type of business.
You can open PepsiCo’s 2019 annual report here.
Calculating NOPAT
As we established in the definition of return on invested capital, we not only have to consider earnings to equity investors (the net income) but also to lenders in the form of interest payments. This is why operating income acts as a pre-debt measure of earnings. To then arrive at that measure of earnings after tax, we need to make some adjustments.
There are essentially two ways to arrive at NOPAT:
In the operating approach, we use earnings before interest and taxes (EBIT) and adjust the number for the tax liability.
NOPAT = EBIT (1 – Tax Rate)
The tax rate figure used in this formula is not equal to the actual taxes paid if the company has debt. We are in effect acting as if we pay taxes on the operating earnings. But in reality, a company gets to subtract interest expenses from their taxable income. This is commonly known as the tax shield.
If we were to use actual taxes paid in the calculation of NOPAT, we would in effect double count the tax benefit from debt – once in the return on capital and again in the cost of capital. We want to avoid doing that.
In the financing approach, we can start with net income and then add back interest expenses adjusted for the tax shield. But here, we would also need to remove other non-operating items.
NOPAT = Net Income + Interest Expenses (1 – Tax Rate) – Non-operating Income (1 – Tax Rate)
The following table shows how we go and take PepsiCo’s accounting income statement to arrive at NOPAT in the reformulated income statement for 2019.
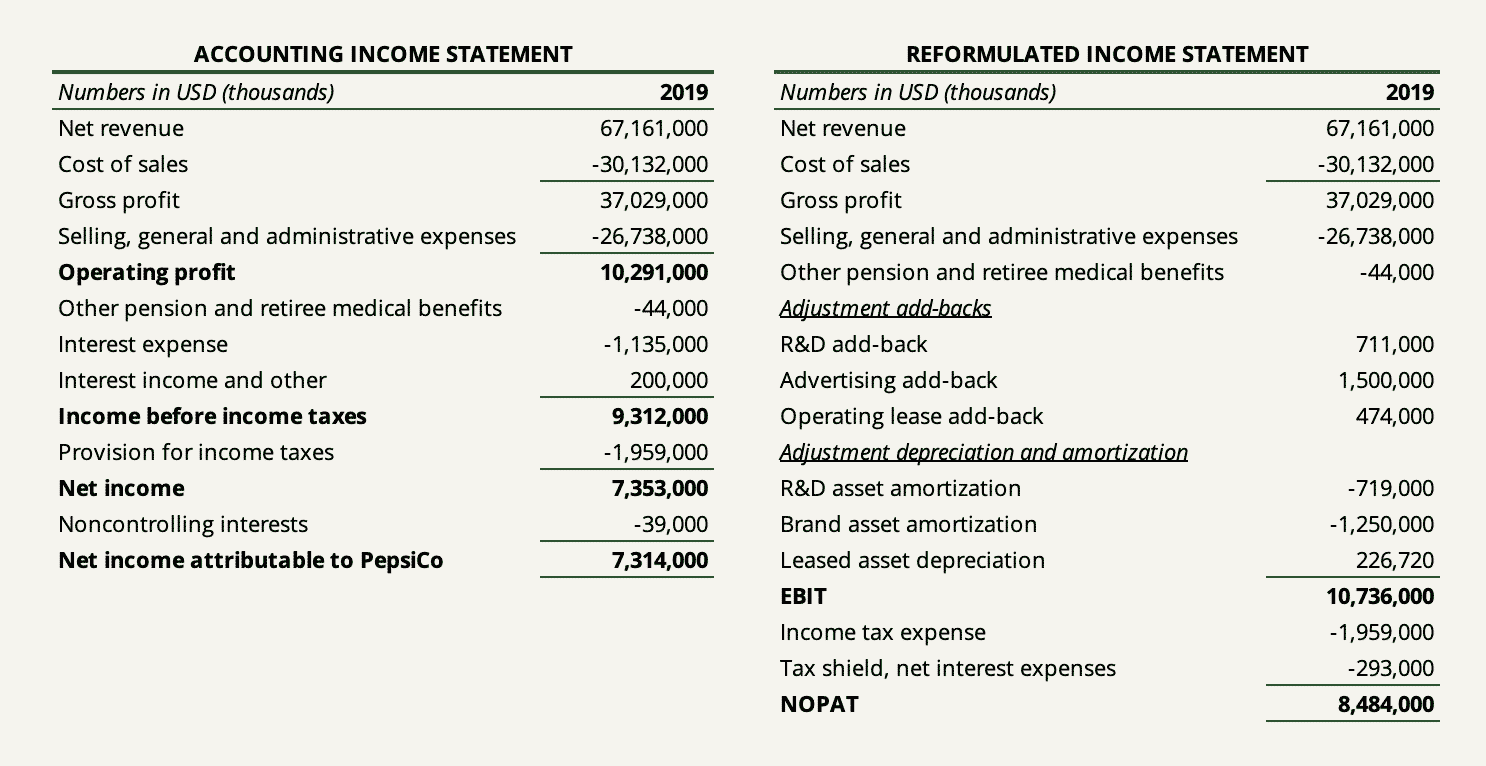
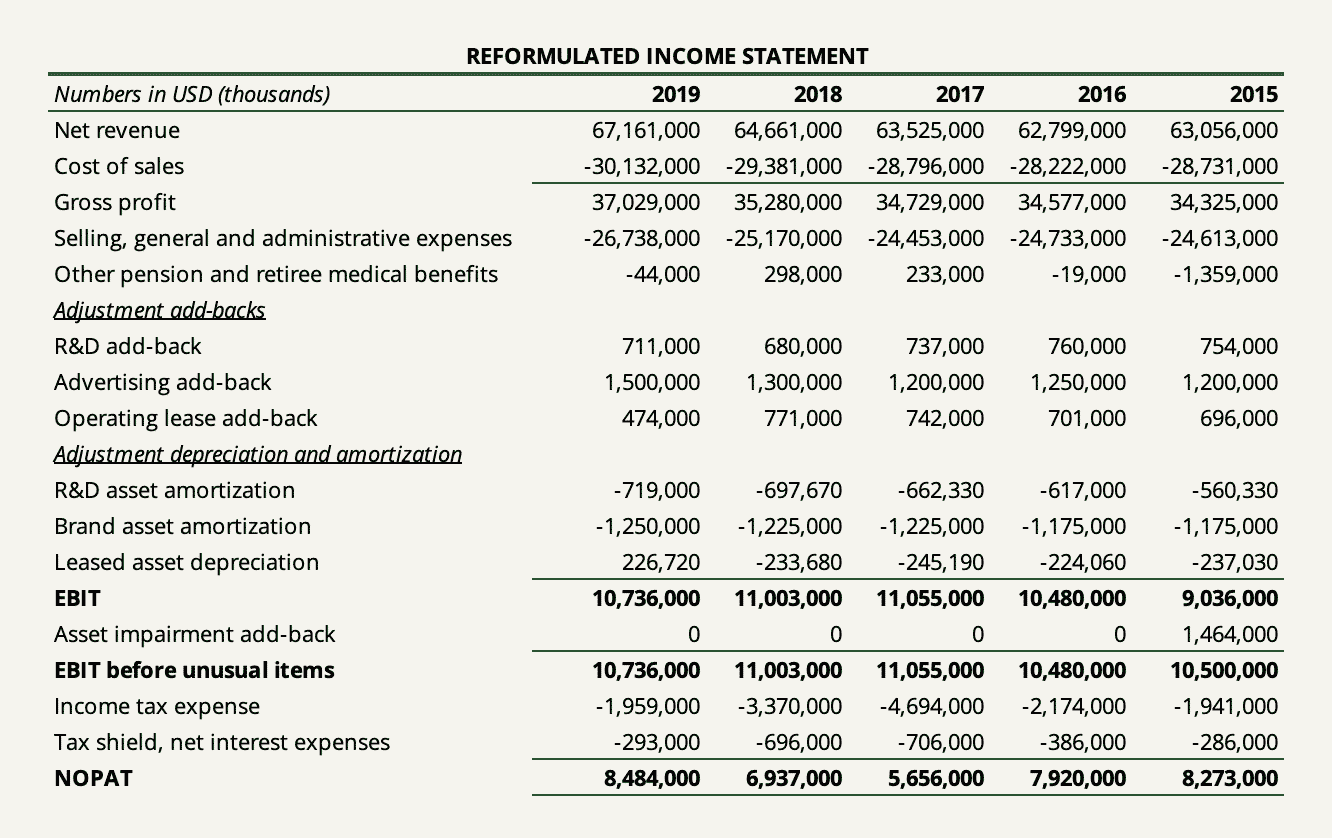
The following shows the reformulated income statement for the past five years.
Calculating Invested Capital
Like with the calculation of NOPAT, we can also use an operating and financing approach to arrive at invested capital. Each method can either provide insight into the efficiency of asset utilization or financing choices. The great thing is that the fundamental accounting equation ensures that both sides balance. Therefore, ideally, we would calculate invested capital using both sides of the balance sheet to have a complete overview of what net assets are needed to run the business as well as how those assets are financed.
As you could probably guess, the operating approach to determining invested capital takes the company’s total operating assets subtracted by the company’s total operating liabilities. The number reached is net operating assets (in short, NOA).
A proper method is to divide operating assets into their current and non-current nature to gauge the magnitude of operating assets the company has invested in for the next twelve months. Accounts receivable and inventories generally take up the majority here. Non-current operating assets may include items such as property, plant, and equipment (PP&E), intangibles, capitalized lease assets, etc.
In the financing approach, we look at the sources of how the company’s operating assets are financed. We take equity, add all interest-bearing liabilities, and subtract interest-bearing assets. The debt to include here is frequently not only the straight debt shown on the balance sheet. Other liabilities to take into account include capitalized leases (more on that in a moment), deferred taxes, and/or pension liabilities.
The following shows how we go from PepsiCo’s accounting balance sheet to determining invested capital in the reformulated balance sheet.
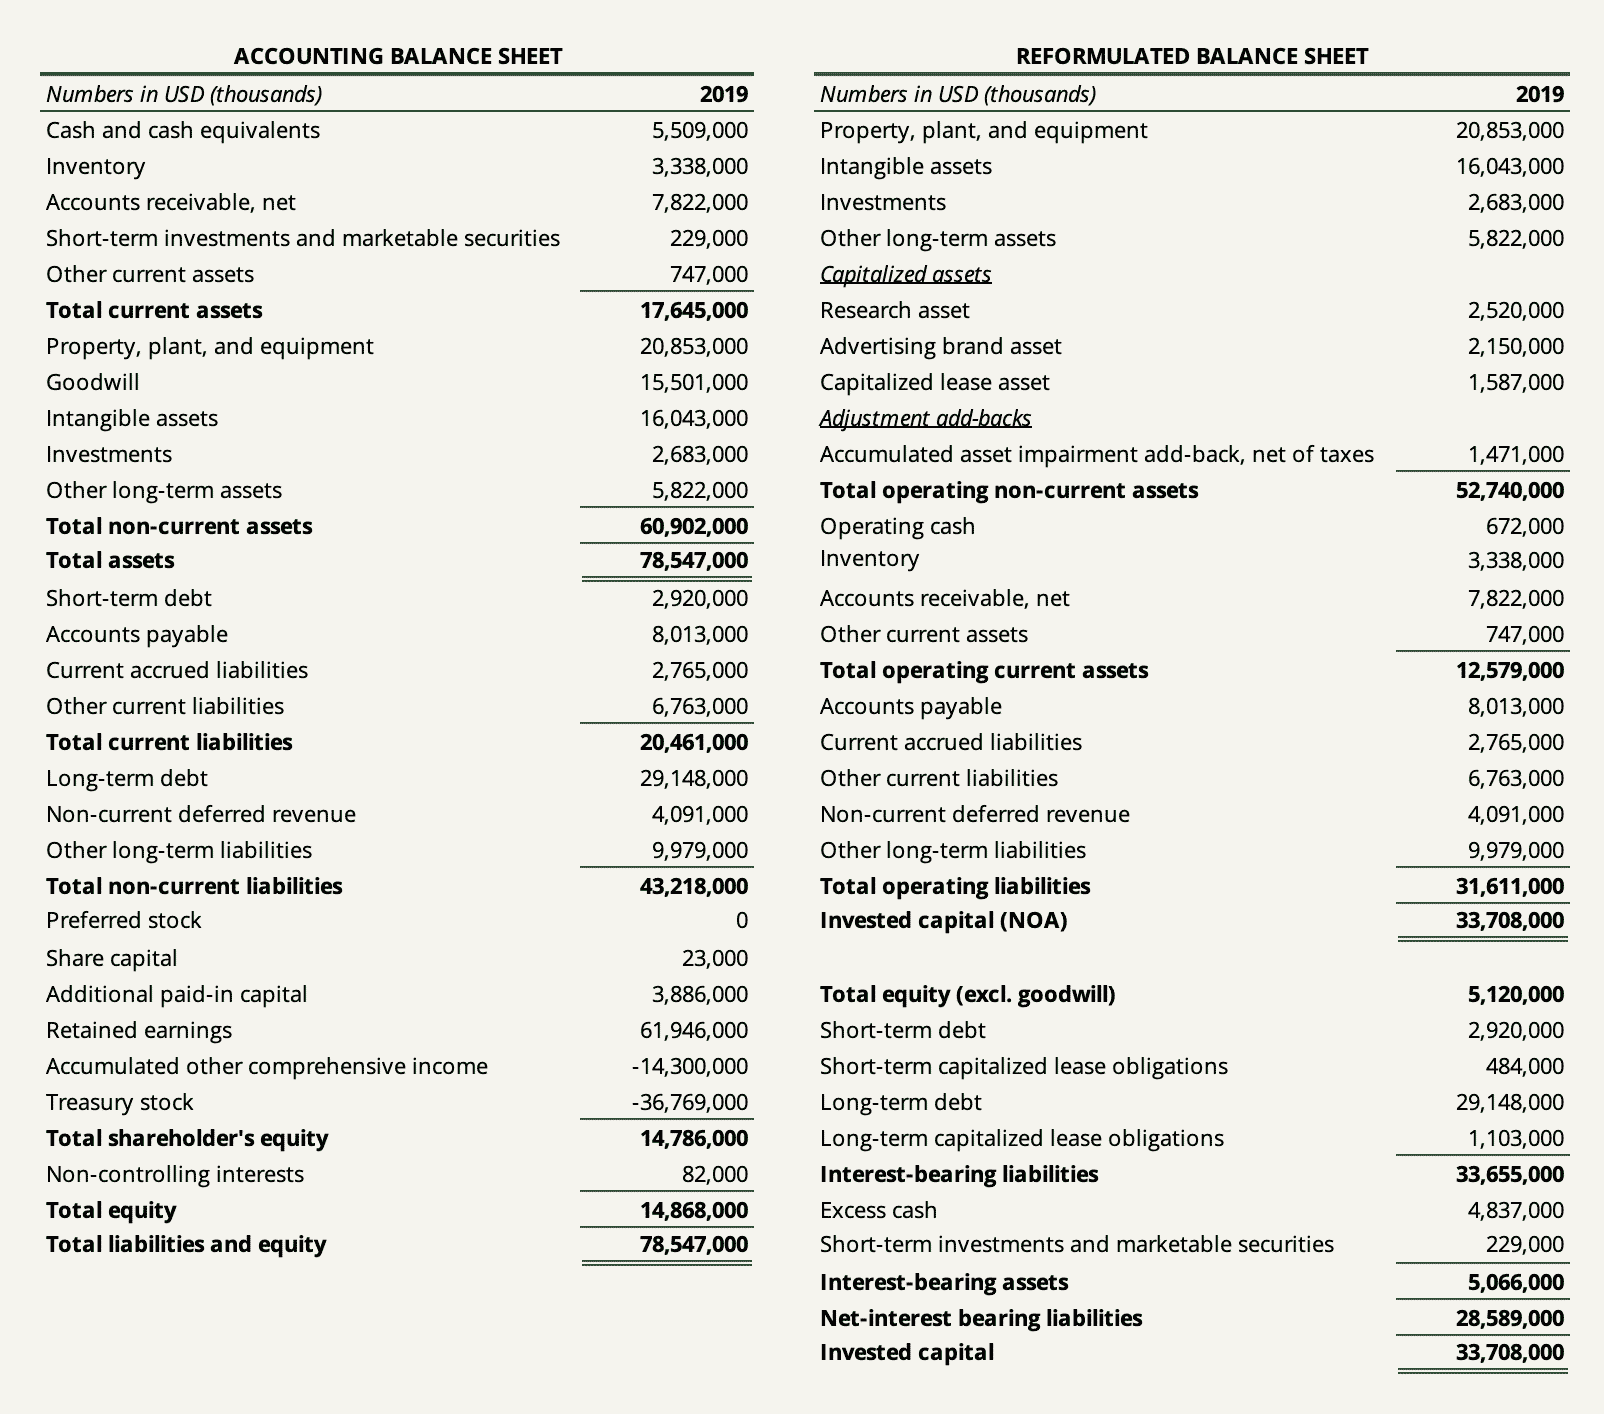
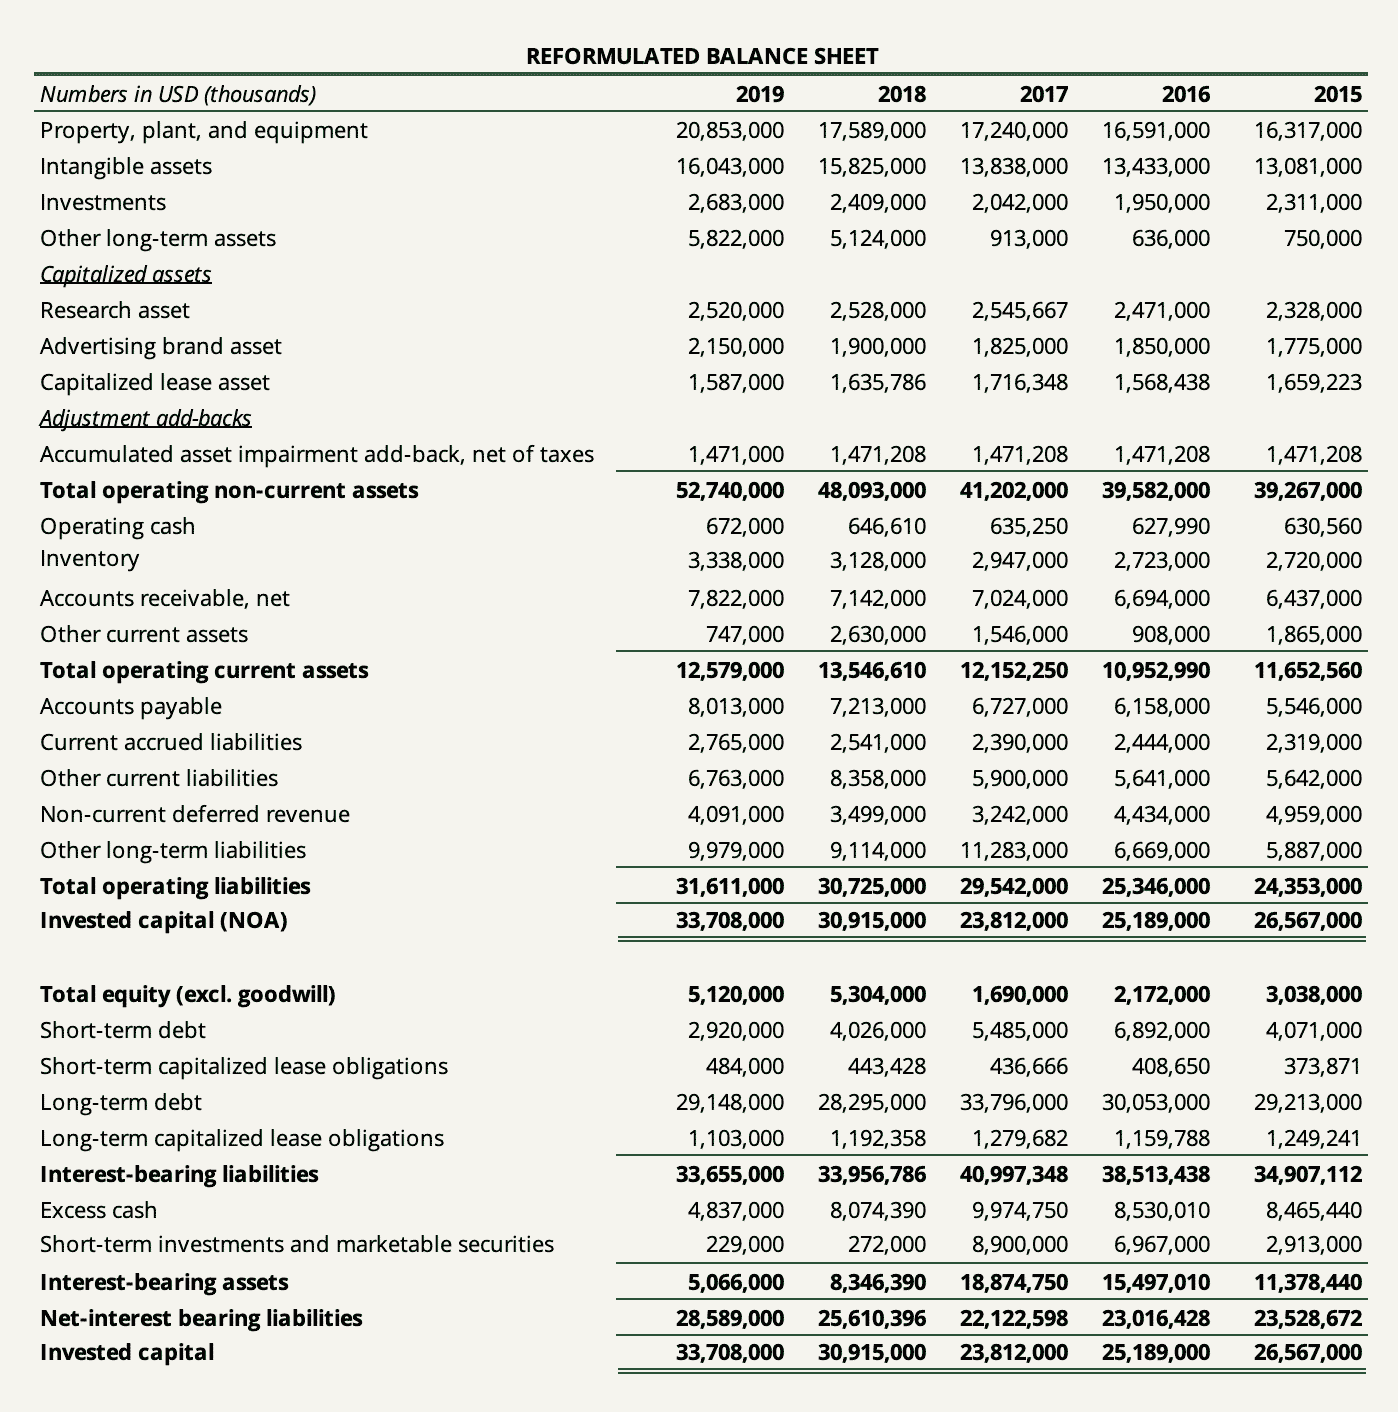
The following shows PepsiCo’s reformulated balance sheet for the last five fiscal years.
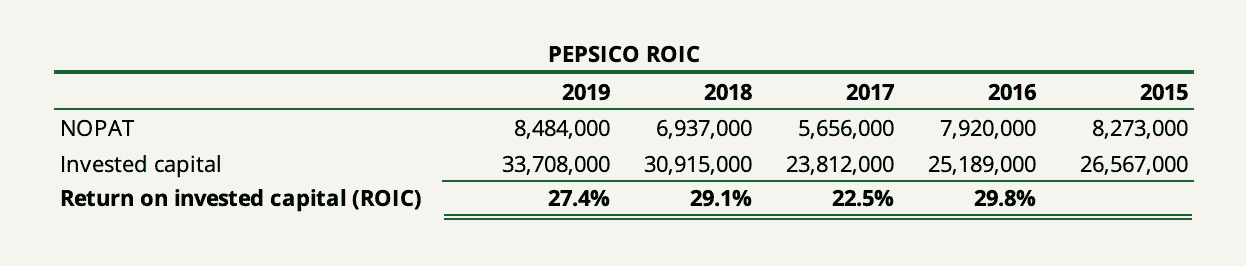
We can now compute PepsiCo’s returns on invested capital by taking NOPAT for each given year divided by the invested capital figure at the end of the prior year (timing difference t-1).
As you have probably noticed, simply rearranging accounting statement items is not all we have done to compose the reformulated income statement and reformulated balance sheet. There are other practical issues needed to be thought through or adjusted in order to reflect the economic reality of the business. For example, we have created some assets, added back R&D expenses and brand advertising expenses, and replaced them with an amortization schedule. The same thing with operating leases. And then there are some tax adjustments and write-down add-backs.
Let’s go through each in the next section.
Much Needed Accounting Adjustments
The difference between a good and bad analysis of return on invested capital is to what extent the company’s accounting earnings and book value is to be blindly trusted. Therefore, the most sensible course of action for the investor is to not take accounting earnings and book value as a given but to adjust those numbers to get a better measure of the returns earned by a company on its investments as well as the magnitude of investments made.
The following goes through all the adjustments that an analyst would have to consider when determining NOPAT and invested capital. The ones that have not been relevant to PepsiCo include equity method investments and discontinued operations.
Equity Method Investments
When the company owns an interest in another company, giving it a significant influence over the investee, such an investment is recorded using the equity method of accounting. This typically occurs when the company owns between 20% to 50% of the investee’s equity.
The way an equity method investment is accounted for is first recognizing the investment on the balance sheet at acquisition cost. Goodwill may arise as well which will form part of the one-line item (the investment). Subsequently, in future years, the company recognizes its share of net income/losses on its income statement with a corresponding adjustment to the recorded equity investment. Additionally, the company adjusts its recorded investment for received dividends, distributions, and other-than-temporary impairments.
In terms of operating profit and invested capital, equity method investments can be tricky since such investments can either be classified as operating or financing items depending on the purpose of the investment and the context. The real question to ask oneself is whether the equity investment(s) is a necessary component of the company’s core operations (e.g. if the investee is a critical part of the company’s supply chain). If so, it should be included in operating assets. If not, it should be classified as a financial asset since we can probably assume that the investment was made using excess cash.
Now, let’s say that the company recognizes ‘equity income’ every year on its income statement and does so within its ‘other income/expense’ line items (the items typically shown between operating profit and interest items). Let’s also say that we determined the investment to be a critical part of the company’s operations and want to include it in NOPAT and net operating assets.
In order to properly reformulate the income statement, we would have to add back the taxes paid on the equity income to calculate the right EBIT. The reason why this is important is that the company recognizes the after-tax income earned at the investee. EBIT is a before-tax measure. Then, to subsequently arrive at NOPAT, the taxes paid should be deducted again. The best way to do this is obviously going to each investee’s annual report to derive the actual taxes paid on the earnings but another way is simply using the company’s marginal tax rate to separate out the taxes.
It’s also important to note that the income statement and balance sheet must match. If an equity method investment is included in NOPAT, the corresponding asset must be included in net operating assets. If not, the asset must be classified as a financial asset.
Taxes
Equity method investments are not the only reason why taxes are important in this work.
A common error made when determining NOPAT is simply adjusting EBIT by the actual taxes paid by the company to calculate NOPAT. However, NOPAT is a measure that captures the earnings of a company before financing costs. Since NOPAT assumes no leverage, we need to remove the tax benefit that the company gets by paying interests on its debt. As stated previously, this is commonly known as the tax shield.
The same principle applies to other non-operating items such as equity income and unusual operating items netted out (except for goodwill impairments which are non-tax deductible) – more on that in a minute.
Secondly, there’s the question of what tax rate is appropriate for the computation of NOPAT. We can either use the effective tax rate or the marginal tax rate. Which one to use depends on how we’re going to use the figure computed ex-ante or ex-post.
The effective tax rate is usually used to compute NOPAT. But using a marginal tax rate will sometimes yield a more robust (albeit understated) value. In doing projections, it is far safer to use the marginal tax rate since the effective tax rate is really a reflection of the difference between the accounting and the tax books.
R&D Capitalization
A company invests in research and development with the main purpose of getting an advantage or developing an asset that is expected to provide a multi-year payoff to the company’s earnings generation. However, that’s not how accountants see it. In accordance with accounting principles, companies must expense R&D investments in the same fiscal year that they are spent. The reason is that accountants find no way to reliably measure the future benefits of outlays allocated to R&D.
To some companies, directly expensing R&D matters little. But for others, it can have a huge ripple effect implications on the perceived profitability and capital invested in the business. In just 2019, Alphabet spent $26 billion on research and development, $2.5 billion more than the company spent on net purchases of property, plant, and equipment. These efforts do not show up on the balance sheet and depress operating earnings each year.
The solution is to convert historical R&D expenses into a research asset which will be amortized over the life of the asset. Therefore, we have to make an assumption about how long it takes for R&D to be converted, on average, into commercial products. Obviously, such an assumption varies from company to company depending on the nature of its research. But a good rule of thumb is about 6 years which we used in our capitalization of PepsiCo’s R&D.
Brand Advertising Capitalization
The same principle that applies to R&D also applies to brand advertising expenses. Arguably, the amount a company spends on strengthening the value of its franchise is an investment expected to provide multi-year benefits. In just 2019, PepsiCo spent $3 billion on advertising expenses.
Again, the economic solution is to capitalize such investments into a brand asset. It requires making assumptions about amortization and how much of the company’s advertising expenses are directly spent on brand strengthening. For the capitalization of PepsiCo’s brand advertising expenses, we assumed 50% using an amortization period of 2 years.
Operating Lease Capitalization
The accounting standards updates, IFRS 16 and ASU 16, changed the accounting landscape for leases and required that companies must capitalize virtually all leases, effective from January 1, 2019. The leases incurred before the effective date need not be restated. This means that for a lot of companies where operating leases matter a lot, we find less financial comparability before and after the effective date. It also means that the financials reported before the effective date provide very little insight into the company’s true profitability and level of debt.
Therefore, if a company reported significant operating leases prior to the new accounting standards and we wish to have a proper time-series overview of the company’s true return on invested capital, these prior leases must be capitalized. The economic rationale is that operating leases must be treated as debt and put on the balance sheet.
Unusual Operating Items
Some items reported within operations by the company might be extraordinary or really unrelated to the core operations. Such items may or may not include items such as asset impairment charges, restructuring costs (if they truly are non-recurring), severance costs, litigation costs, certain pension costs/income, etc. In order to get a proper perception of what we are attempting to measure, some of these unusual items should be ignored or taken out.
Be aware that some unusual items might be hidden within operating items such as SG&A and disclosed separately in the footnotes, MD&A, or cash flow statement. Some companies disclose them under ‘selected financial data’.
For example, asset write-downs are unusual charges that don’t appear on the income statement because they are bundled within other line items. Asset write-downs bring two effects that distort the computation of ROIC. First, they distort core-operating costs. Second, they reduce the carrying value of the corresponding assets. If we do not account for write-downs, what happens is that both NOPAT and invested capital go artificially down based on a discretionary decision by management. This in turn boosts the perceived returns on capital in future years since the denominator in the computation will be held down by the new carrying value.
Excess Cash
Cash is usually netted out of invested capital since it’s an interest-bearing asset not directly invested in the business while it sits in the bank. However, it can be argued that some cash is really required in order for the company to run its business. Some cash might be earmarked for the company to reach a state of break-even, some for short-term capital spending needs, and some for day-to-day operations (like the cash sitting in registers).
The question of excess cash is much debated and it’s easy to understand why. It’s a difficult thing to arbitrarily attempt to determine what amount of cash in a company’s bank is operational and which is excess. The amount of cash necessary for operations can differ widely, to the extremes, during different times and different economic environments. The question becomes even more difficult the earlier the company in question is in its growth cycle. Obviously, a young growth company would be required to hold more operational cash than a steady-state firm in the majority of cases.
A viable solution is generally to look at operational cash as a percentage of revenue. If the company is mature and requires little capital to operate, one to two percent of revenue would be a good rule of thumb. If it’s young and growing, five to ten percent would likely be a better estimate, but it, of course, depends on the business.
For PepsiCo, we estimated the company’s operating cash using one percent of revenue.
Goodwill
Goodwill is generally not included in invested capital on the assumption that it is paid for growth assets (meaning future investments of the acquired business) and not assets in place. After all, when a company acquires another company, goodwill arises as the excess to the amount the acquired company actually invested in the business.
However, another argument could be made that some of the overpayment of the net assets of the acquired business may consist of expected synergies of the combination. In that regard, the acquiring company might perceive that part of the overpayment as an investment today. Hence, a portion of goodwill should be included in invested capital.
As a general rule, if we do not expect the company in question to do many deals going forward, excluding goodwill probably provides a better picture of returns on incremental capital. If a company’s business depends on its continued acquisition spree (or if that is the business model itself), it would in some cases make sense to include all of goodwill.
For PepsiCo, we netted out goodwill from invested capital completely.
Impairments
The question of impairments is related to the question of unusual operating items above. The idea behind adding back asset write-downs to invested capital is that investors should hold management’s feet to the fire to deliver returns on all the capital they have allocated.
But, it’s important to use common sense and understand how management uses capital. If management has changed lately or the impaired asset becomes obsolete for the business (e.g. intended to be sold), it would make little sense to “punish” current management into perpetuity by increasing the invested capital base.
If we do decide to add back asset write-downs, it’s very important to do so net of tax savings (excluding goodwill impairments which are non-tax deductible). Note that if have decided to net out all goodwill from invested capital, we can’t add back goodwill impairment charges.
For PepsiCo, we added back about $1.5 billion of asset write-downs charged net of tax savings in the fiscal year of 2015 which raised the company’s invested capital base in subsequent years.
Discontinued Operations
The question of whether to include discontinued operations in the computation of ROIC depends on the purpose of using the measure. If we want to look at the company ex-post, it would make sense to include discontinued operations in the computation. If we want to look at the company ex-ante, it should be excluded. The treatment of assets held for sale should be directly tied to the choice made to NOPAT. If income from discontinued operations is included in NOPAT, assets held for sale should remain in invested capital, and vice versa.
Conclusion
If you stuck all the way to the end of this lengthy piece on return on invested capital, you are of a different casting.
The return a company makes on the capital it invests is at the center of corporate finance and how to correctly value the business. The key number in a valuation is not the cost of capital that we assign a firm but the return earned on capital that we attribute to it. Consequently, there is a payoff to measuring it correctly in the first place.
In this article, I walked through how to properly think about ROIC, and, most importantly, its pitfalls. We considered why it’s so important for judging capital allocation skills, how it’s widely misunderstood, and how to calculate it properly using accounting adjustments, reformulation, and common sense.
Here’s the tragedy of the story: just studying the returns on invested capital a company has generated in the past says little about the incremental returns it will generate in the future. Financial acumen matters little here and forecasting a company’s future excess returns is really a different ball game. But studying the past may grant us clues to the future.