With bank accounting and words such as HTM (held-to-maturity), AFS (available-for-sale), and unrealized losses suddenly becoming a part of every investor’s daily vocabulary from the verge of a few large, failing banks (you know who they are), what I’ve found is that there’s this recent and faulty tendency to treat all financial institutions the same. On the face of it, you kinda get why investors do it. What financial institutions do is they hold a lot of money for other people. They then take these large pools of money, called float, and they invest it in relatively liquid assets, earning the difference until the money will eventually have to be paid back. The source of that pool varies between types of financial institutions; for banks, it’s mostly depositors, and for insurers, it’s mostly policyholders. But the game is the same: managing money and earning the differential between what comes in and what comes out.
The source of the float and the methods to manage it are what mostly distinguish a bank from an insurance company. Unlike banks, insurers bear solvency risk on both sides of the balance sheet, in the risks they underwrite and the assets they buy. Where banks pretty much know the running cost of their liability side, sloppy underwriting at an insurer can nullify or worsen the returns generated by investing the float but can also turn out an advantage if the underwriting is profitable. And unlike banks, recent news being cases in point, insurance companies aren’t subject to bank runs. When bank depositors want their money quickly, there’s little a bank can do but sell their fixed income portfolio to meet redemptions, and if there’s a large unrealized loss on bonds that the bank initially booked to hold to maturity, such a run can punch a big hole in the bank’s statutory capital. Insurance companies can be subject to tragedies of equal proportions (from catastrophes) but generally use less leverage and can reinsure for protection. Besides, insurance liabilities are more predictable. If an insurer has 5-year claims on average, that’s 20% of the portfolio that needs to be liquidated at max (if there’s a 15% unrealized loss on the portfolio, that would only be a 3% hit). Both types of financial institutions come down to term matching, but because of the insurer’s added visibility, insurance companies are generally more flexible with how they can invest their float.
That said, just like banking isn’t inherently a great business, insurance isn’t so either. The insurance industry has fairly low entry barriers and marginal differentiation among a large number of underwriters, any of whom may onboard recklessly priced risk at any given time. Still, there are important factors that can turn individual banks and insurers into wonderful companies. Since this write-up is about insurance, specifically the most successful insurance company in recent years, I’ll put banking aside for now and focus on what makes a great insurance company.
From a risk management perspective, you can build a mental model of insurance through two dimensions:
1) You can either have non-opportunistic or opportunistic insurers. When investors think about opportunistic insurers, they often assume that some companies are better at cycle management than others—expanding when markets are hard and pulling back when conditions soften and competition increases—as if the industry in aggregate forsakes underwriting discipline and overly focuses on top-line growth, even as premium rates decline. This is often boilerplate. Pretty much all insurance companies boast that they have a culture of ‘opportunistic’ underwriting discipline, but that should be table stakes. Disciplined underwriting is critical to long-term success in the insurance business, and some insurers are better than others, either due to experience or courage. But when I say ‘opportunistic’, I mean on the investment side.
On the investment side, the vast majority of the industry falls in the non-opportunistic category. This isn’t necessarily a bad thing. ‘Opportunistic’ is usually not a word you want to be passed around about you in the money management business. Non-opportunistic insurers (think State Farm, Allstate, or Nationwide) focus almost entirely on underwriting, either operating profitably by writing very selective policies or utilizing lots of leverage to earn a satisfactory return on equity by investing the float in low-risk, low-return investments that match their future liabilities—an ancillary activity that’s typically outsourced to third party managers. On the other hand, opportunistic insurers (think Berkshire, Markel, and Fairfax) not only allocate a significant part of their float to equities but also buy non-insurance businesses outright. And because this approach, when done right, may bring outsized returns compared to non-opportunistic insurers, opportunistic insurers may give more leeway as to how profitably the insurance side of the business operates, as long as the money lost is less (meaning cheaper) than other equal opportunities to raise money. Both models work within different instances and circles of competence, but generally, investors tend to favor insurers that get more of their income from consistently profitable underwriting than those that get most of their income from the float—the reason being that so few insurers manage to underwrite profitably every year that doing so indicates a hard-to-copy advantage, whereas anyone can look smart for a while by gearing up the float or reaching to yield. In other words, an investment edge is harder to verify than an underwriting edge. The counterargument, of course, is that <90% combined ratios aren’t the holy grail either since that likely means the insurer isn’t optimizing for float size, thus forsaking an important income stream.
2) You can further divide insurers into short-tail or long-tail risks. The ‘tail’ is the time required to learn of and settle claims which is an important consideration when an insurer manages its reserves. Short-tail claims (e.g. most property, auto, general liability, travel) are those that are settled relatively quickly. Each loss event is small and the law of large numbers applies more cleanly, making the reserving and pricing more synchronized to maintain profitability. However, these factors are also what make short-tail underwriting a price-driven commodity and a game of reaching the biggest low-cost advantage. Long-tail claims (e.g. asbestos, workers’ compensation, product liability) take years or more to settle and are subject to greater uncertainties in reserving. In extreme cases, like with asbestos, long-tail claims may take upwards of 40 years to settle, continuously lurking on the balance sheet of the insurer and occasionally requiring huge revisions to cover sins of the distant past. With something short-tail and granular like auto insurance, claims patterns are risky but not really uncertain. Long-tail business is vastly more uncertain but isn’t as price-sensitive, making it prone to reckless underwriting since consistent under-pricing can take years to uncover.
This brings us to why the insurance business (and banking) aren’t inherently great businesses. An inherently great business can be run by anyone without inept management inflicting mortal damage to the company. That isn’t insurance. In insurance, the ability and temperament of management are all-encompassing because it’s too easy to bet the company and there are a lot of temptations to do the wrong thing, either excessively reaching for yield that causes term mismatch or writing loads of bad premiums. Such short-termisms are insurance’s kryptonite. Because insurance is by and large a commoditized, basic necessity (like fresh air), there’s no substitute other than for the uninsured to mechanically chip away at their paycheck, stuffing the money under the mattress, and praying for good weather. Reckless management at an insurer can easily tap into that need and achieve outsized growth by aggressively pricing policies or accepting risks that prudent competitors are wise enough to avoid. So growth in itself is far from a reliable measure in insurance. In fact, if anything, abnormal growth in premiums written is more often a cause for concern than something to celebrate.
That is with four unlesses: As an insurance company, you can rationally outgrow competitors even in a soft market if you either 1) have a significant low-cost competitive advantage, which may stem from superior technology or sales channels, 2) account for the growth with consistently prudent reserving, 3) have an investment edge that can afford a higher combined ratio, and/or 4) have a unique culture that treats customers well which translates to higher retention rates and higher LTV (on a unit basis, a newly written policy is typically money-losing in year one but gets increasingly below a 100% combined ratio the more years the policyholder retains). All four characteristics feed on each other. With a low expense ratio, you’re more likely to think longer term and avoid imprudent reserving to boost quarterly numbers. You can invest for the long term and provide superior service to your policyholders, which insurance brokers appreciate and are more likely to direct volumes your way.
For reasons I’ll discuss in the following, Fairfax Financial possesses all of the four characteristics that make for a great growth insurance business. Popularly seen as the ‘Canadian Berkshire’ due to its value investing principles (but a fluke at 1/40th of the size in terms of market cap), it falls right into the opportunistic camp. 15 years ago, if you’d asked an insurance analyst about Fairfax, they would tell you that it isn’t an insurance company, but an investment company masquerading as an insurance company. And 15 years ago, they would have been right. Fairfax was never your general insurer focused on maximizing underwriting profits, limiting volatility, and protecting dividends in any given year. And compared to Berkshire which mostly writes short-tail risk, Fairfax leans more to the long-tail and was never afraid of a little extra volatility on both sides of the balance sheet, trusting that the Hamblin Watsa investment committee’s acumen would more than make up for it. For the first 20 years of its corporate life, this was uncommonly true:
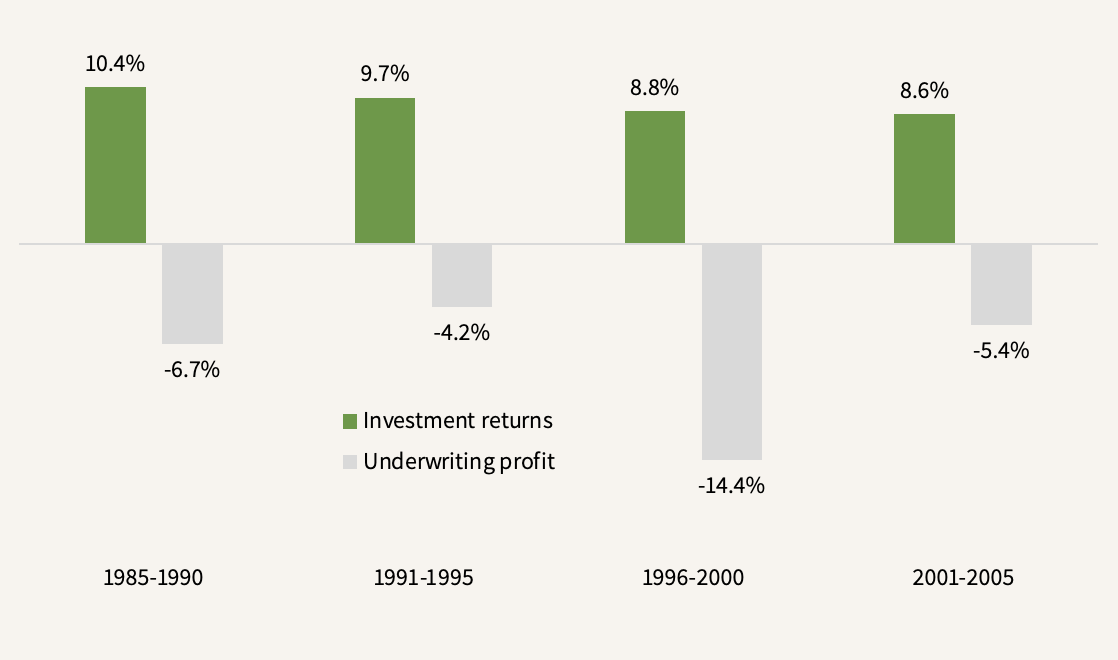
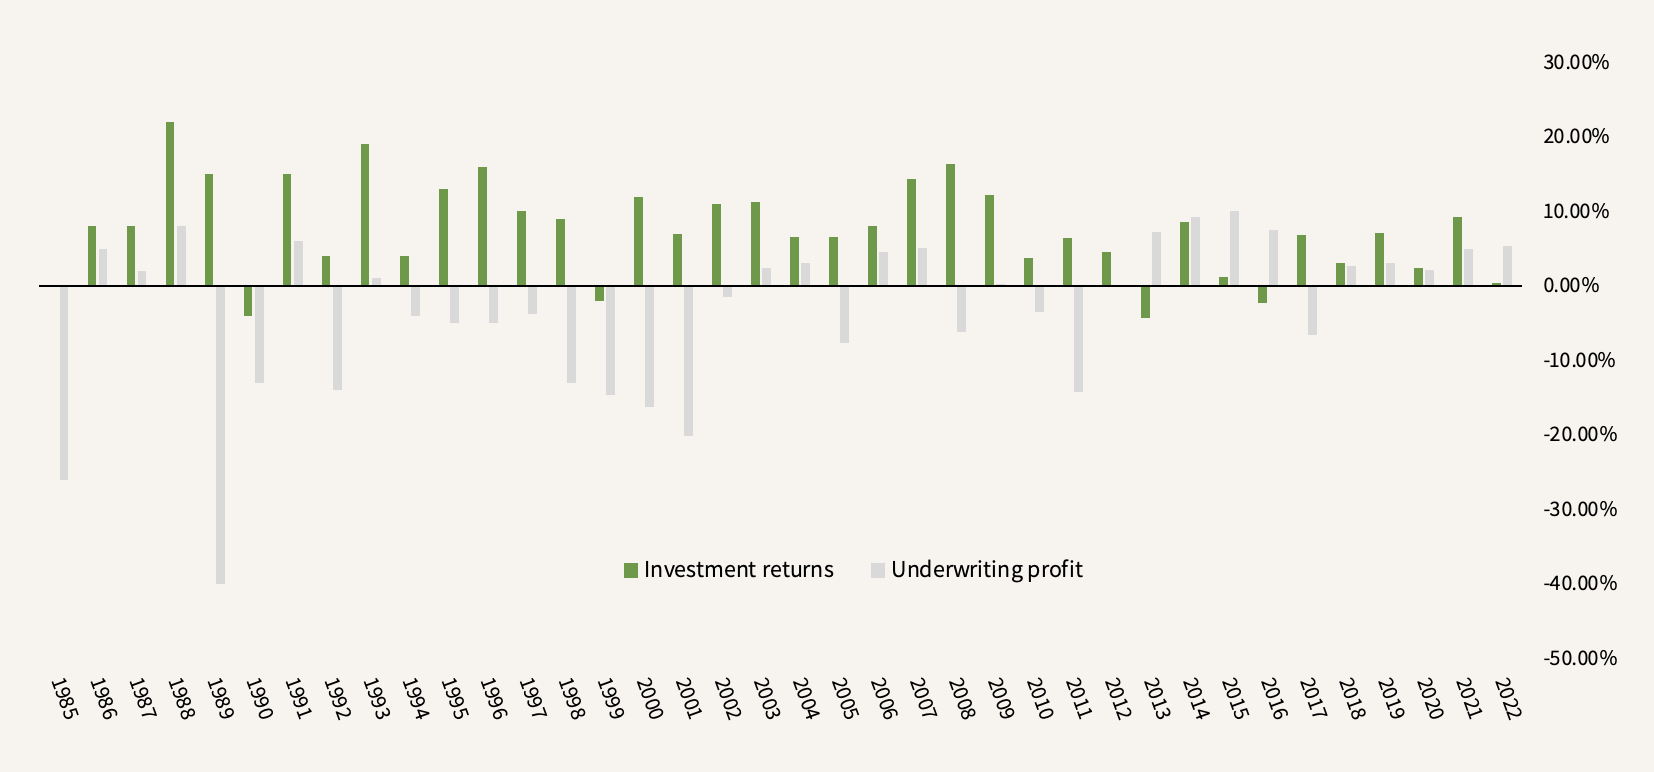
With an average of 108% combined ratio (8% cost of float), Fairfax still managed to compound its book value per share (BVPS) from $1.5 to $162.76 over this 20-year period, a 26.3% CAGR thanks to the magic of levered compounding. Over the company’s full 37-year history, BVPS has compounded at 17.8%, a feat achieved only by ~1% of all stocks on American stock exchanges since 1985. But it was no straight line:
Fairfax has undergone several transformations throughout its history. One thing each of these phases had in common, though, is that the team at Hamblin Watsa has always sought to invest Fairfax’s float in statistically cheap securities, which would sometimes involve private equity-like turnarounds when market sentiment was negative and sometimes involve holding large amounts of cash when it perceived markets to be overpriced. During the GFC, the constant focus on the downside worked out remarkably when Hamblin Watsa bought credit default swaps to hedge against the impending crash, writing to shareholders in 2005:
[…] for a few years now, we have said that we are protecting our shareholders’ capital from a 1-in-50 year or 1-in-100-year event. By definition, [a housing crash] is a low-probability event (like Hurricane Katrina) but we want to ensure that we survive this event if and when it happens.
Post-GFC, though, Fairfax failed to adapt to the new environment. After striking it big in 2009, with BVPS increasing 21% in 2008 and then another 33% in 2009, Prem Watsa and co saw other 1-in-50-year disasters on the horizon, including mass deflation, that never materialized. So as the combined ratio finally dipped consistently below 100 after 25 years of operation, it was almost ironically this time when Fairfax entered its investment slump, losing an average of ~$500mln/year pre-tax between 2010-2020 on bets like (but not limited to) BlackBerry, Greece, inflation hedges, shorts, and greenfield African banks—a significant chunk out of the average of ~$860mln in operating income earned over the period. The sudden tailwind from profitable underwriting was hampered by the mix of Fairfax’s hedges and ill-timed opportunistic investments (‘ill-timed’ because some of these investments now look to bear fruit, a topic which I’ll come back to). Of course, by far the biggest cost of the lost decade was what you don’t see in the numbers: opportunity costs. As tech high fliers pulled the tide that lifted all boats, the statistically cheap stocks that Fairfax favored were left behind while the macro hedges (which, given their annual cost, were more ‘bets’ than hedges) proved fruitless. For Fairfax, the decade post-2010 was akin to driving around a race track with the handbrake pulled. BVPS CAGR’d at a measly 3%.
Consequently, the word around the investment community became that Hamblin Watsa were bad stock pickers. That, even though the driver behind the low investment returns was more tilted to the bond portfolio that was dragged down by low duration and continuously decreasing interest rates over that decade. Over the last 10 years, under $1 in $5 of the investment portfolio has been in common stocks. Helped by regulatory handcuffs, over 40% of the portfolio has been in low-duration bonds. None of Fairfax’s peers, most with larger bond allocations and longer durations, has been immune to falling interest rates.
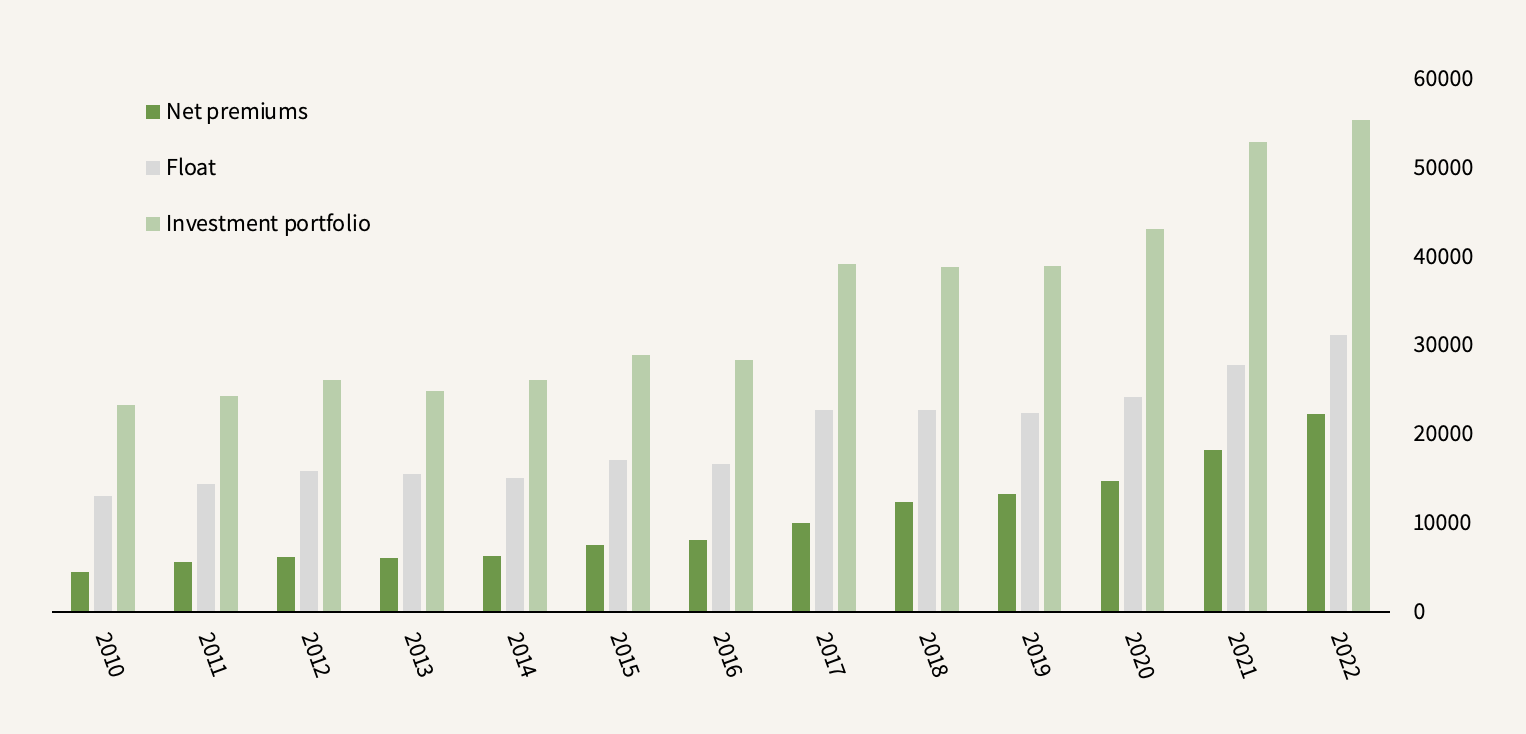
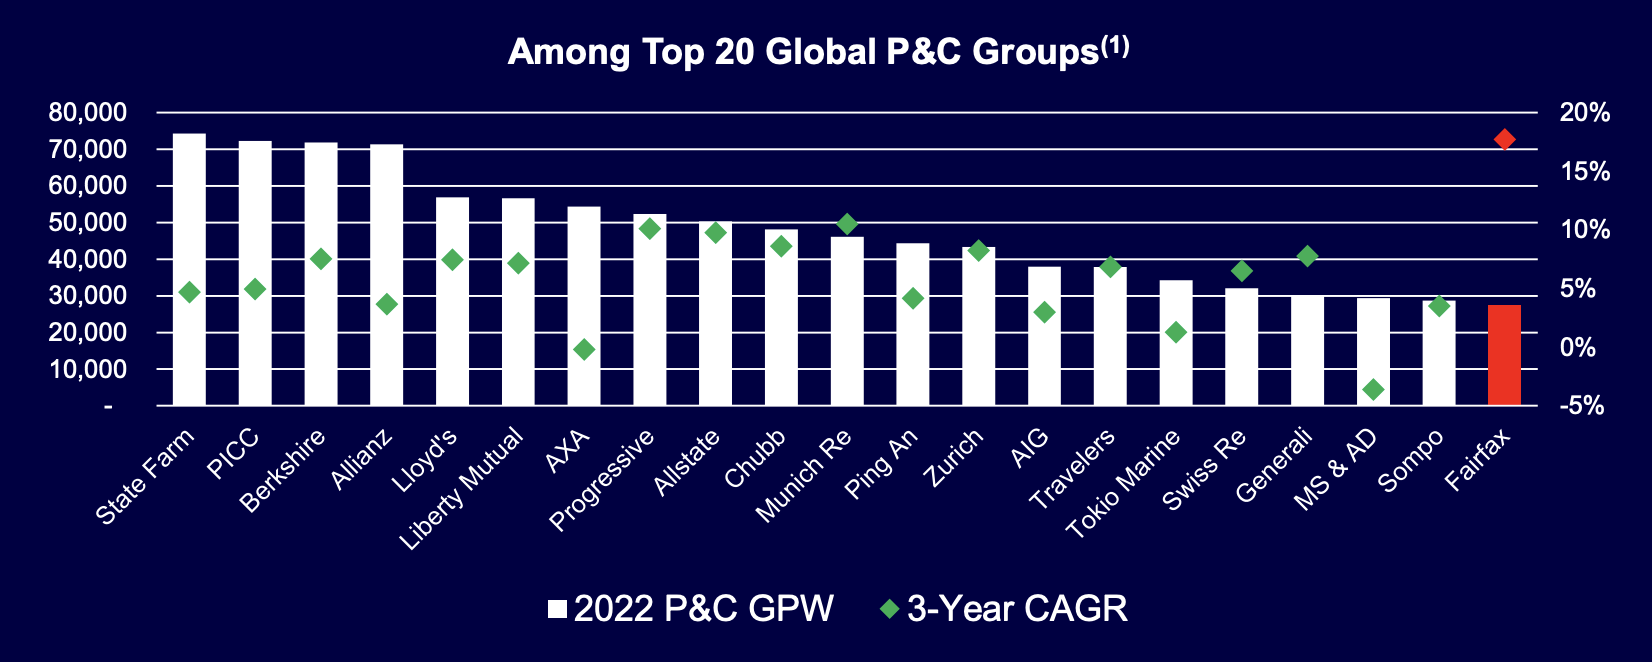
That said, the fact that interest rates pulled fixed income down only makes Fairfax losing out on sizable equity gains (falling interest rates mean less gravity in equities) all the more disappointing. So it’s no wonder why the poor investment returns were/are all the limelight. Yet, honing in on just the investment side of the business fails to miss the bigger part of the Fairfax story. While everyone ran around discussing whether Prem and co had lost their magic touch, Fairfax’s insurance group marched ahead in the background to build a track record of growth that would put it on par with a thriving tech company. What the increasingly profitable combined ratios in the post-2010 decade fail to catch is one important dimension: scale. Over that decade, the insurance business went from $4.4bln net written premiums in 2010 to $14.7bln in 2020, then jumping to $22.3bln in 2022, a 14.5% CAGR. The investment portfolio grew from $21bln in 2010 to $55.5bln. In a matter of a little over a decade, Fairfax had grown into one of the 20 largest P&C insurers in the world.
A $55.5bln investment portfolio, roughly half of which is financed by 5% negative-interest float (Fairfax’s current 95% combined ratio) is coiled to churn out vastly different earnings numbers in a higher-interest environment than Fairfax has ever witnessed. Due to this humongous increase in cash-making float, Fairfax is in another form than it’s ever been and the company’s past history gives poor clues as to how it may perform in the future (wait till the end for the verdict).
The recent underwriting growth story can be divided into two phases:
1) M&A (2015-2017)
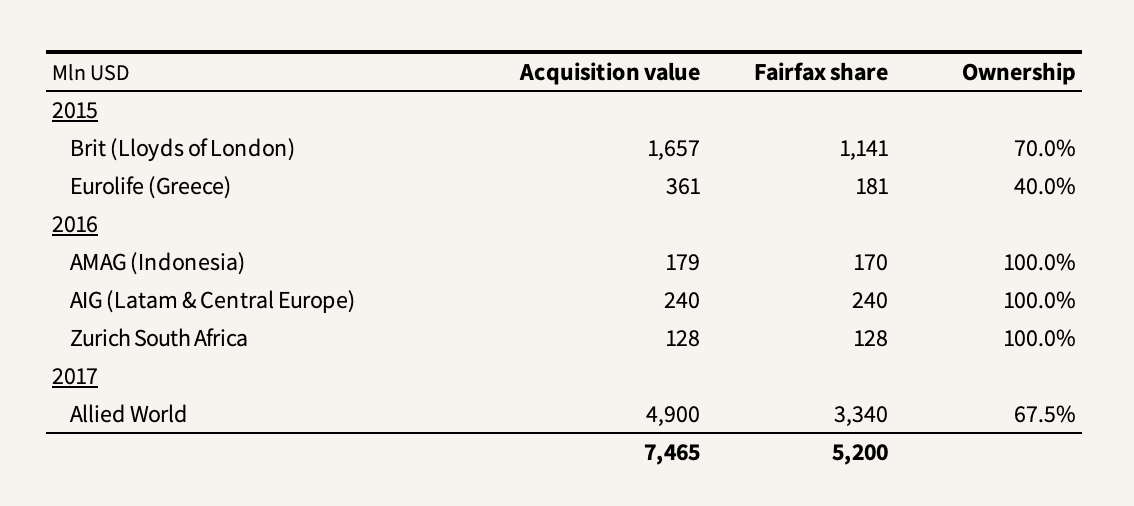
Fairfax has always taken advantage of acquisitive growth which is what has turned it into the global, decentralized insurance holding co that it is today, spanning 200 different profit centers across >100 countries. But the short period of 2015-2017 was notably impactful since Fairfax completed two large and some smaller insurance acquisitions during the period, spending a total of $5.2bln:
2) Hard Market (2019-today)
Whether those acquisitions were any crystal ball prediction by management, I don’t know, but Fairfax was opportunistic and the timing was perfect. Just as Allied World entered the fold, it went on to CAGR ~18% while its combined ratio went from 98% to 91% after an 8% cat loss impact in 2022. Brit CAGR’d >20% over the same period. What happened was that the insurance industry entered a hard market, which is a rarer occurrence than many tend to think. The mental model that people usually have about the insurance cycle is that hard and soft markets ebb and flow with equal proportions and regularity. But that isn’t true. You would have to go all the way back to 2001 after 9/11 to find the last hard market and then all the way to 1986 (the tort crisis) and 1976 (stagflation) to find the prior ones. All the intermediate years have been characterized by declining rates. That’s why, when a hard market does occur, it’s about stepping the gas pedal as hard as you can. In the 2002-2005 period, Fairfax wrote net premiums at 1.5x its statutory capital.
An important detail in the large acquisitions of Brit, Eurolife, and Allied World is that Fairfax didn’t have $4.7bln lying around to pay for the deals. So it mostly financed them by partnering with minority interests such as OMERS, a Canadian pension fund, and issuing 7.2mln shares at an average price of $462/share, a 36% increase in the share count over a short period of three years. And while that may seem controversial for an insurer practicing conservative value investing, you gotta understand how integrated a capital allocation strategy this has been throughout Fairfax’s life. In fact, since 1985, Fairfax has issued a total of 29.5 million shares as it expanded net premiums written from $10mln to $10bln in 2017 (a net increase of 22.8mln as Fairfax also retired 6.7mln shares over the same period). Taken right out of the Henry Singleton playbook (Teledyne’s share count quadrupled from 1965-1970 as Singleton went on an acquisition spree, only to buy back 90% of the shares in the decade after 1972), Fairfax isn’t afraid to trade its stock to pay for shinier objects with the prospect of buying it back cheaper later.
Evidently, what happened in the years after 2017 was that Fairfax repurchased 3.3mln shares for cancellation at, guess what, an average price of $474/share, a whole lot cheaper than at issuance considering net premiums had more than doubled, the investment portfolio had increased 41%, and underwriting profits had gone from losing $642mln to earning $1.1bln over the period. In 2021 alone, Fairfax bought back 9% of its stock at 0.8x price-to-book after selling a 9.99% stake in Odyssey, Fairfax’s largest subsidiary by premiums written, at 1.84x price-to-book. Furthermore, in late 2020, Hamblin Watsa bought total returns swaps (TRS) that gave it exposure to another 1.96mln Fairfax shares (~8.4% of the current share count) at an average cost of $372.96/share for a total of $733mln. This investment alone may turn into one of Fairfax’s best ever, having returned 85% over a 29-month period. Hamblin Watsa may have had a prolonged period of bad stock picking but they sure can trade their own stock and are likely to buy back more than they issue in the future.
The buybacks don’t only account for the own stock, though. Over the past couple of years, Fairfax has slowly moved into the current third stage as the hard market looks to be maturing: the cannibalism stage, by slowly buying out minority shareholders. In 2021, Fairfax increased its ownership of Eurolife from 50% to 80%, bought out Singapore Re from its previous 28.1% ownership, and paid $733 million in 2022 to increase its ownership in Allied World from 70.9% to 83.9%. Next up are Kipco (buyout) and GIC (from 43.7% to 90%) paying the latter in installments over the next 4 years. As these minority buyouts pick up steam (Fairfax has the option to purchase the remainder of Allied World until Sep-2024, Odyssey until Jan-2025, and Brit until Oct-2023), Fairfax’s structure will be increasingly simplified and easier to understand.
Here’s how the Fairfax insurance group looks today:
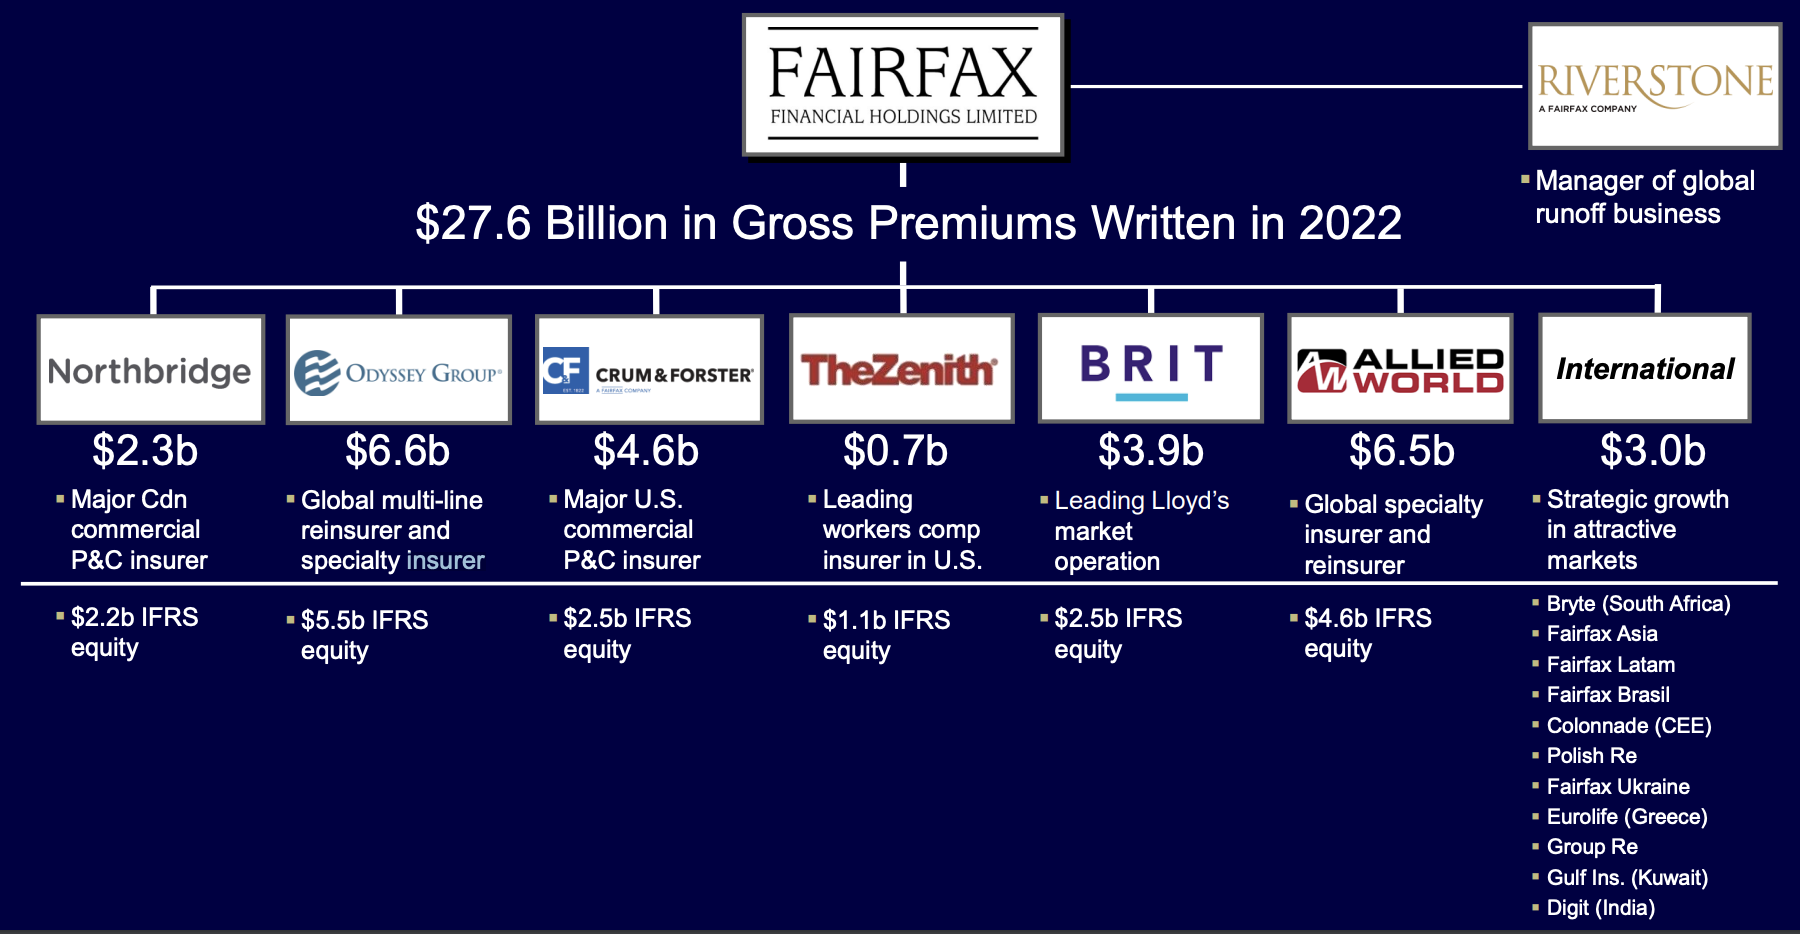
The common denominator for the success of this group is Andy Bernard, who was installed as President of the insurance group in 2010. Needless to say, due to the aforementioned history of Fairfax’s insurance operations post-2010, Bernard has built one of the best insurance track records ever in history. Just by glancing at the numbers, you can almost feel the underwriting cultural shift that happened once Bernard was put in charge. Bridging the gap between Bernard’s insurance side and Hamblin Watsa’s investment side of the business is Peter Clarke, the President of Fairfax, who effectively takes the role of Chief Risk Officer. Every insurance deal and large investments are signed off by Peter. What’s remarkable about Fairfax’s culture and what exemplifies the company’s long-term focus is that while both of these Presidents have been with Fairfax for over 26 years, that isn’t anything unusual. On average, Fairfax’s insurance officers have been with the company for 19 years (18 years for the investment team).
All the talk about opportunism, premiums written, short-tail vs long-tail, and so forth is fine and dandy but if you want to get to the bottom of the moat, this is where you’ll find it. Long tenures are the key sign that Fairfax acts truly long-term and has the right incentive system in place. In 2017, Prem stated that he had never lost a single manager to a competitor despite many of them being offered superior compensation. And one thing you’ll notice when you attend/watch the AGM, read Prem’s letters, or watch any interview with him is that he’s the biggest cheerleader of his teams at any chance he gets. He speaks highly about everybody—a culture of integrity and team spirit that’s distilled down in the organization. Insurance presidents are compensated by underwriting profit, not growth, and by running a decentralized holding structure akin to Berkshire with every president having full autonomy and being their own risk officers, Fairfax values trust over synergies. Unlike other executives at Fairfax, Prem doesn’t earn stock-based compensation; he makes money trading his own stock. His share of ownership is 10% (43.9% voting; two of his children sit on the board) and his $600k/year salary has stayed the same for decades.
To some investors, the latter point of family control may understandably be of concern, but in insurance, the benefits of having a controlling, long-term (or permanent) owner can outweigh the shortcomings:
1) Reserving
At the time an insurer underwrites a policy, it makes an estimate of its expected losses and sets aside reserves to cover those losses. As time goes by, the reserve may be adjusted up and down based on how the policy develops. If the reserve is too low, the insurer will increase reserves and take a hit to the current year’s earnings; if it’s too high, excess reserves will be released into earnings.
Reserving policies can vary significantly between insurers, especially across jurisdictions, and these differences are usually enough of a factor to deem relative valuations across peers by earnings multiples meaningless. Various considerations factor into reserving, including short-tail vs long-tail claims, the quality/homogeneity of data, medical cost inflation, court interpretations, claims handling procedures, and so forth. What this means is that a reserving policy can either practice hyperbolic discounting or delayed gratification. Scrupulous management will switch between both, either consistently under-reserving to pump up short-term earnings or over-reserve in a hard market to release reserves and pad earnings in lousy years under the pretense of conservatism. Actual conservative management, however, sticks to consistent reserving—not too far from actual losses but a little to the safe side. The truth is, management is more likely to practice the latter if it has long-term skin in the game.
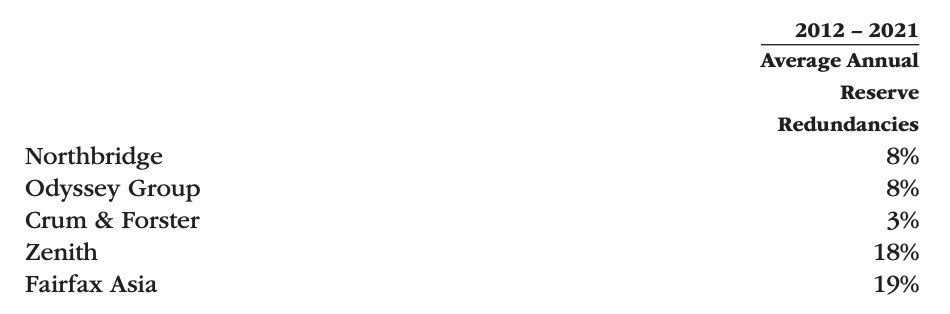
Now, as IFRS 17 has come into the picture, requiring contract liabilities to be discounted, the point of aggressive reserving policies is even more dangerous since you now have a double whammy with possible meddling of the discount rate, few points of which can make huge difference in how to account for long-tail risks—an effect stemming from accountants trying to be too perfect. Regardless of whether management practices an aggressive or conservative reserving policy, it’ll always fizzle out in the end, though. The final loss is the final loss. But it does tell you something about the quality of management that the market may miss. What happens when an insurer is consistently growing its book, the true impact of reserve releases tends to be hidden—the insurer sets aside excess reserves faster than it releases them. Since 2010 when Bernard sped up the underwriting business, Fairfax has had reserve redundancies every year for an average of $418mln/year, or almost 5 points of combined ratio:
2) Capital Allocation
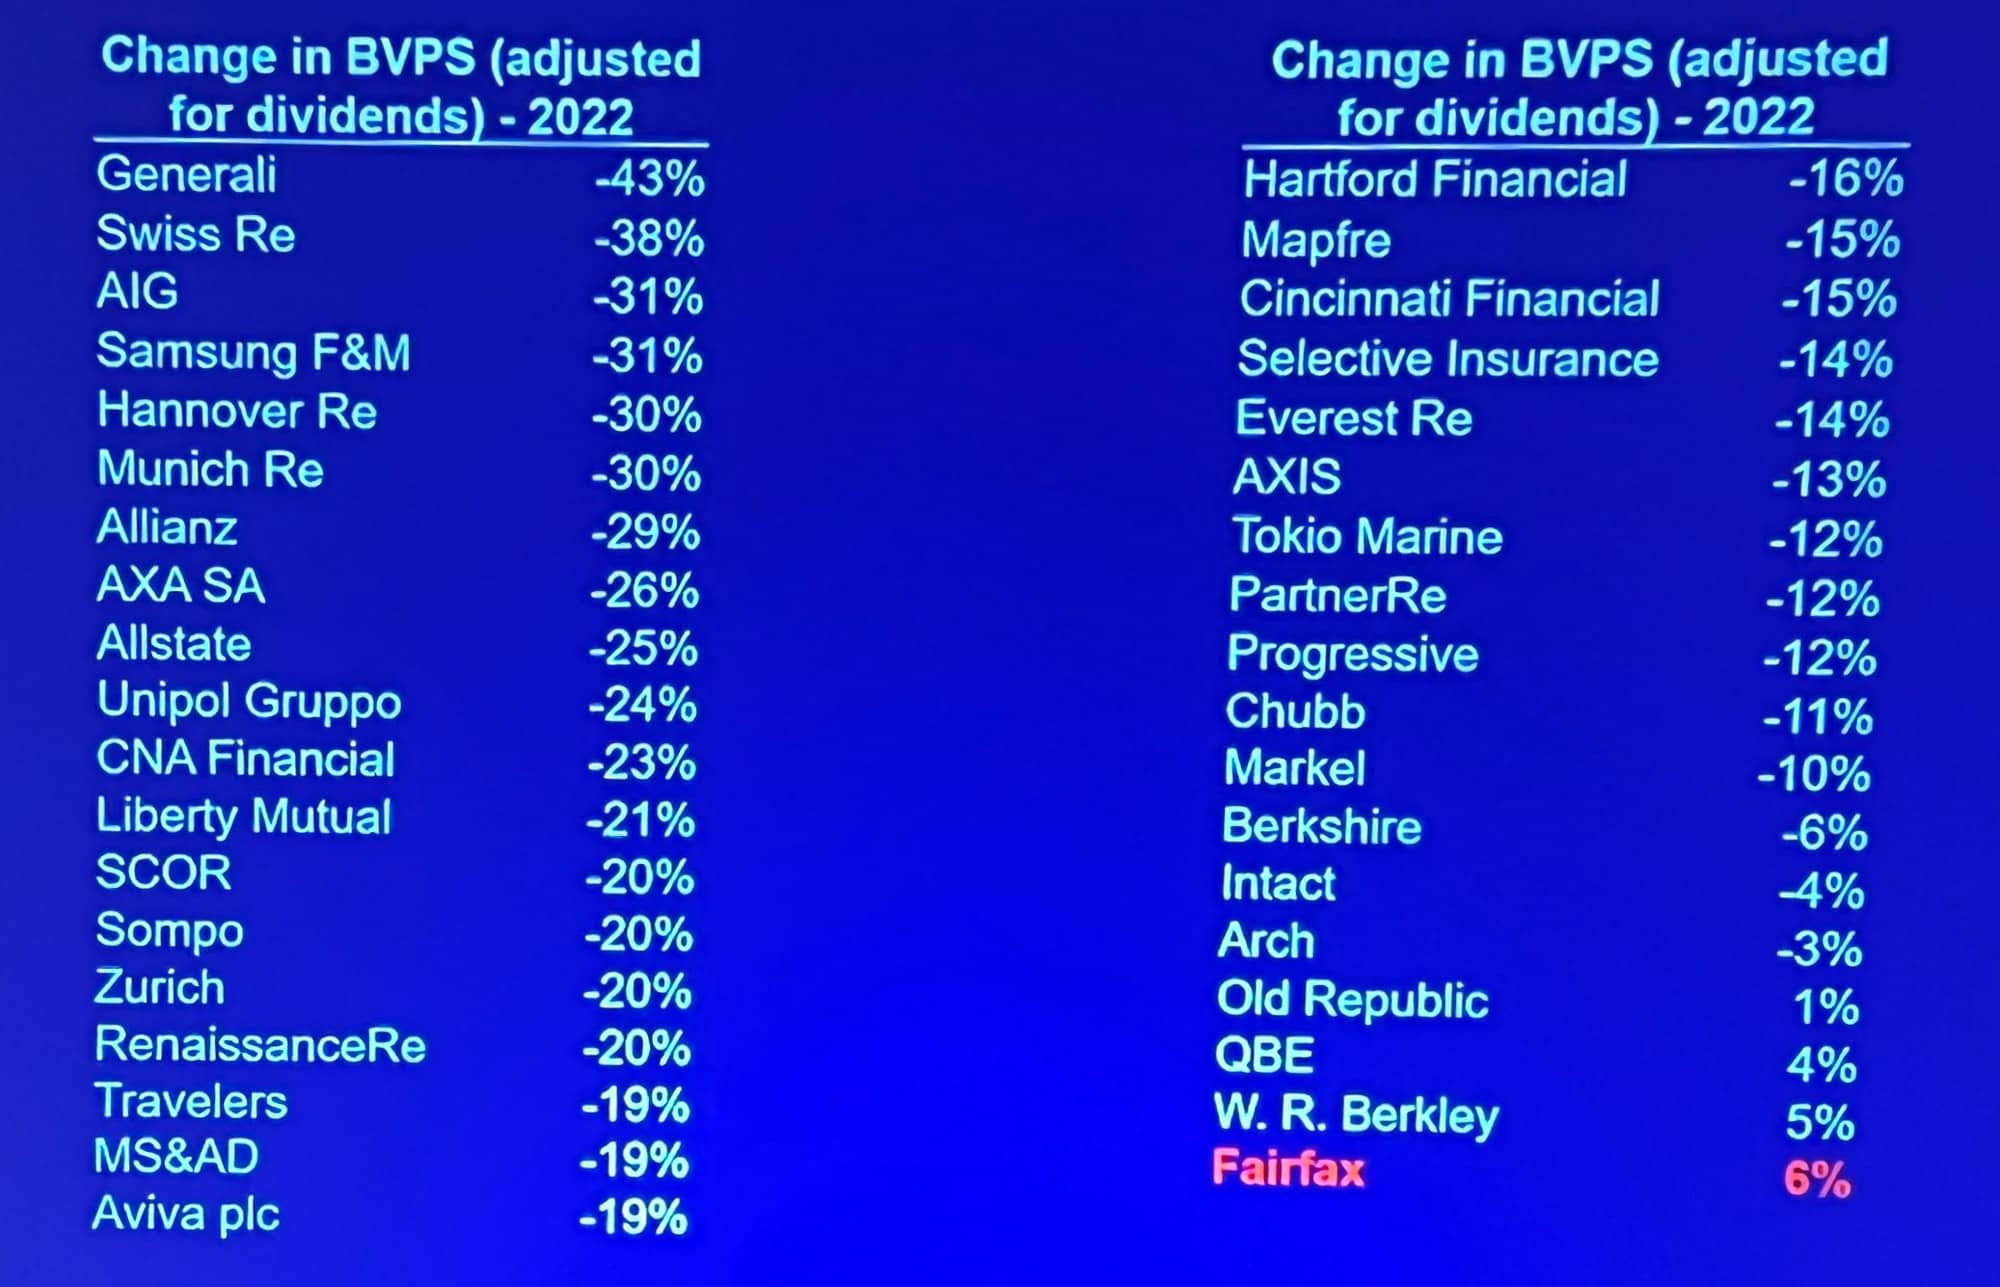
The other positive side of family control is more impactful to terminal value. Coming into 2022, Fairfax’s bond portfolio had an exceptionally low average duration of 1.2 years. Refusing to reach for yield when doing so makes you look stupid in the short term (interest and dividend income continued to drop from $880mln in 2019 to $769mln in 2020 to $641mln in 2021) is not easy when you have a bunch of exterior pressures to please other than eating your own cooking. Part of Fairfax’s bond portfolio was even hedged through forwards to sell US treasuries right before hell was unleashed by the Fed. So when competitors opted to deal with low interest rates by reaching for yield (SVB style), Fairfax only took a 2.8% mark-to-market hit on the fixed income portfolio in 2022 and still increased the BVPS (after dividends) by 6%. Peers on the other hand:
The verdict? Family-controlled insurers are, ceteris paribus, better positioned for opportunism on the investment side. The result? As Fairfax slowly ramped up the duration in conjunction with rising interest rates, it took its run rate of $530mln in interests and dividends and tripled it to a current run rate of $1.5bln which now approaches a three-year duration. I’ve heard a lot of Fairfaxers are disappointed about Fairfax not extending those durations further but I don’t see why Hamblin Watsa would settle for 3-4% when they have lots of other options, including writing >7% mortgages with Kennedy Wilson at average three-year terms. Cash and cheap stocks may also be better options as of now. Having the discipline to not reach for yield for the past half a decade was absolutely the smart choice, especially in an ongoing hard market where competitors are stuck with long durations for the foreseeable future. There’s also an option with staying nimble. At the 2022 AGM, Prem stated that if a recession happens, risk spreads will blow out which would prompt Hamblin Watsa to extend duration significantly.
So if we add things up to run rate operating profits, what do we have? As for interest and dividend income, we can be pretty sure about the aforementioned $1.5bln for the next three years. But there are other sources of income/expenses to account for (you can find and change around my model at the bottom of the write-up):
1) Underwriting Profit
The insurance industry is in a 4-year-old hard market with the strongest pricing cycle shown in a generation. Following the landfall of Hurricane Ian and reinsurance now looking to continue to pick up the slack (being up a risk-adjusted 40-50% for Fairfax in 2022), favorable underwriting conditions are expected to continue into 2023, although more modestly. Furthermore, should interest rates remain elevated, the unrealized losses that many insurance peers will struggle to unwind over many years could prolong the hard market as there’ll be little price competition in underwriting. Assuming that gross premiums increase by 10% in the next three years, a risk retention rate of 78% (the premiums not receded to reinsurers), a combined ratio of 95%, and annual run-off losses of $200mln, I can pencil out a three-year underwriting profit run rate of ~$1.1bln. Every 1 point of combined ratio change would equal a $200mln change in underwriting profit. It should be noted that in the medium term, it’s virtually impossible to predict underwriting results on an annual basis since in any given year shit may hit the fan. Over the long term, a 100% combined would be a good normalized level to assume for any given insurer, especially when treasury bills yield 5%.
2) Share of Profits of Associates and Consolidated Investments
Over the 5-year period ending in 2021, Fairfax’s share of profits of associates (equity method investments) averaged ~200mln/year. Last year, the number came in at five times that at $1bln for the year, mostly driven by three of the non-insurance companies: Atlas, Eurobank, and Resolute.
Atlas, Fairfax’s largest common stock holding by market value, has been an impressive investment. Led by David Sokol, who previously compounded earnings by more than 20% over 20 years at Berkshire’s MidAmerican Energy, and Bing Chen, the company’s largest business is a containership leasing company with a current 1mln TEU capacity, expected to double in the next few years by an aggressive newbuild strategy. Management expects EPS to grow 50% over the next couple of years which translates to Fairfax’s share of earnings perhaps reaching ~$400mln in 2024.
For the first couple of years, Fairfax’s $444mln investment in Eurobank in 2014 during Greece’s debt crisis looked like it may be written down to zero. At one point, the ECB even came in and mandated a 1:100 reverse stock split. But instead of capitulating, Fairfax found value and decided to double down in 2015. And slowly, after Greece elected a pro-business government in 2018 and Eurobank merged with Grivalia Properties, that investment looks mightily good now. Fairfax’s share of Eurobanks profits was $263mln in 2022, up from $162mln in 2021. Fairfax thinks Eurobank will earn €0.20/share in 2023, translating to a share of earnings of >$300mln in 2023.
The investment in Resolute spans back to 2008 and includes several adds along the way for a total investment of $715mln. This year, the company was sold for $622mln including some potentially worthless contingent value rights, and thus looks like a break-even investment—a long-term poor return and sought-after closed chapter.
That these three investments have been vastly different isn’t atypical. If you glance across Fairfax’s common stock holdings and how they’ve changed over the years, you could categorize Hamblin Watsa as an investor with many faces:
a) A venture capital investor that funds startups (ICICI, Quess, Digit, Davos Brands, Farmers Edge, Boat Rocker, Ki).
b) An incubator that fosters early-stage ventures (First Capital, Riverstone, Pethealth).
c) A turnaround/activist investor (Bank of Ireland, Eurobank, Blackberry, Torstar, Golf Town, Performance Sports, Dexterra, Resolute Toys “R” Us Canada, and loads more).
d) A real estate investor (Kennedy Wilson, Grivalia).
e) An asset manager (Fairfax India, Fairfax Africa).
f) A private equity investor (BDT Capital, ShawKwei, JAB’s PE fund).
g) A commodity investor (International Coal, Sandridge Energy, EXCO, Altius, Stelco).
h) A cannibal investor, increasing ownership in what it already owns, including its own stock.
Selling Resolute musters a recent rationalization of Fairfax’s equity positions, especially in the turnaround (c) bucket. Other examples of that include selling the non-real estate business of Toys “R” Us Canada, merging Fairfax Africa with Helios, and writing down and taking EXCO private. Turnaround investments increasingly look like a thing of the past and what you’ll probably see going forward is for Fairfax to dive more into buckets a, d, and h, with the former of which already include several hidden assets.
Digit (which is consolidated) is a golden hidden asset. Essentially the Indian equivalent of Lemonade, Digit is a mobile-first, digital insurance company that grew gross premiums by 50% in 2022 to >$900mln at a 114% combined ratio—an incredible growth path given it was just a start-up five years ago. The interesting part about Digit is that before the company raised $200mln in 2021, it was valued a $900mln on Fairfax’s balance sheet. The valuation came in at $3.5bln, allowing Fairfax to book a gain of $1.49bln, or $53 of additional BVPS. Now, Digit is in talks of an IPO that could easily unlock additional value. There are likely other levers Fairfax could pull to crystallize more hidden value on its balance sheet, including Ki, another hypergrowth insurer under Brit which was seeded in 2020. Lots of things are going on under the hood within Fairfax’s insurance circle of competence. As for bucket d, Fairfax started a real estate investment partnership with Kennedy Wilson in 2010 to diversify the bond portfolio. Fairfax currently has $2.4bln invested with Kennedy Wilson at 7.9% floating rates so that’s a likely added $190mln.
I could go on and on about the ifs, buts, and maybes of Fairfax’s equity positions (other important assets include GIC, Fairfax India, and Recipe), a lot of which will be pure speculation, so without losing sight of the big picture, here’s how I see the operating profits from associates and non-insurance consolidated investments in the short term: profits from associates will drop from the 2022 level to ~$800mln in 2023 (just simple conservatism since adding up Atlas, Eurobank, and Kennedy Wilson would get you there) which will grow 10% from then. And as for the non-insurance business, I assume ~$400mln, strongly contributed by Recipe moving from the equity method to consolidated investment, and I assume that to grow 10%/year from then.
3) Overhead
Corporate overhead expenses were $296mln in 2022, or 1.33% of net premiums written. I’m assuming that ratio stays fixed, growing with net premiums written.
Adding all the buckets up…
- Interests and dividends: $1.5bln
- Underwriting profit: $1.1bln
- Share of profits of associates: $0.8bln
- Non-insurance operating profit: $0.4bln
- Corporate overhead: -$0.3bln
…gets us to $3.5bln in expected operating income for 2023. That’s not accounting for potential gains on the equity positions. If we add a little net gain on investments of 1%/year, add a $275mln gain on sale to be received from selling Ambridge under Brit in 2023, subtract debt interests (which I assume to grow with float), taxes, minority interest (which I assume to grow with earnings), and preferred dividends, we can back into an average of ~$2.4bln of after-tax earnings run rate, or <7x the current market price. After dividends and not counting buybacks, that translates to ~13% CAGR in book value over the next three years.
The question is: what would you pay for that? When I bought the stock in May of 2020, it was a time when it traded at 60% of book value. It was also a time with considerable uncertainty around the end-of-year fair value of the investment portfolio. Rarely have underwriting and investment results carpooled in Fairfax’s history but that’s where we are now.
Looking across peers, they typically trade for 1.5x to over 2x book value. Fairfax, with its higher growth profile and bigger spending on non-mark-to-market investments (in other words, its book value is smaller than if it had saved instead), trades at a current 1x. While Fairfax as an investment case may seem convoluted (writing this piece while keeping my tongue in my mouth wasn’t easy), what it all comes down to is whether you think the company will be able to deliver its continued long-term goal of compounding BVPS by 15% or whatever lower number you think. If it does compound at 15%, however, you’ll not only get a 15% return by buying at 1x book value but something north of that, because then it won’t continue to trade at 1x for long. While it’s not indicative of where Fairfax is today, it’s worth mentioning that at one point in the late-1990s, Fairfax traded at 5x. With something like Fairfax, you can only forecast a few years into the future since too many variables change after year three so this call rests on your assessment of management’s ability and integrity.
One last note about focusing too much on book value: as Fairfax may enter a long period of significant buybacks, transactions that will likely take place at prices above book value but below Hamblin Watsa’s estimate of intrinsic value, the math of such buybacks has it that each transaction will make the per-share intrinsic value go up, while BVPS goes down. Over the long term, this combination will cause the book-value scorecard to become increasingly out of touch with economic reality.
Disclosure: The author owned shares of Fairfax Financial (FFH.TO) at the time this report was posted. This may have changed at any time since.