As many readers know, one of my investing heroes is Mohnish Pabrai, manager of Pabrai Investment Funds and author of The Dhandho Investor.
One of Mohnish’s methods of improving his investment process is through what he calls shameless cloning – shortcutting by cloning other great investors’ best ideas.
Entering an investment just because someone else likes it, without understanding the reasoning behind it, is dangerous and generally not a good idea.
But what Mohnish means is to use other highly successful investors as a screener while subsequently applying one’s own independent thinking on the subject. This strategy holds true not just in investing, but throughout almost all life aspects of life. Sam Walton was probably the world’s best, shameless lifelong cloner of what was working at his nearest competitors and he ended up outperforming everyone.
So this is what we did at Junto with GrafTech International. We copied Mohnish’s investment at Pabrai Funds and applied our own thinking.
GrafTech is an industrial company making high-quality graphite electrodes essential to the production of steel through electric arc furnaces. This means that GrafTech supplies steelmakers with an essential smelting production element, graphite electrodes, which wear out and will eventually be replaced since electric arc furnaces need graphite electrodes to produce.
We’ll go into further detail on the business and industry shortly.
In August 2015, Brookfield Business Partners, the private equity arm of Brookfield Asset Management with an incredible investment management record, took GrafTech private.
In the two-and-a-half-year private ownership period, Brookfield greatly repositioned GrafTech and subsequently returned the company to the public market in April 2018 through an initial public offering with 35 million shares priced at $15 a share.
After the public offering, the stock price has hit a high of $24.36 and is currently at a low of $9.80.
What’s Graphite Electrodes?
There are two methods of producing steel: EAF (electric arc furnaces) and BOF (basic oxygen furnaces).
While BOFs were traditionally the preferred method of steel production because it operated directly from smelting and refining virgin iron ore, the [smaller] EAFs, using graphite electrodes, primarily involves re-melting and cleaning up scrap steel.
This gives EAF producers greater resilience, a more variable cost structure, lower capital intensity, and more environmentally friendly nature. EAFs produce approximately 25% of the carbon dioxide (or CO2) emissions of a BOF facility and does not require the smelting of virgin iron ore or the burning of coal.
Graphite electrodes are the only known commercially available products that have both the capacity to handle high levels of electrical current and the capability to sustain the high levels of heat generated in EAF steel production. Therefore, graphite electrodes are an essential part of the EAF process which wear out and will have to be replaced.
But despite that essentiality, graphite electrodes only make up about 1-5% of EAF steel producers’ costs of production which makes them an easy sell as long as EAF production continues to retain demand.
The primary ingredient in graphite electrodes is a scarce resource.
There are two general types of graphite electrodes used in steelmaking: UHP (ultra-high power) used in EAF steel production and HP (high power) used in BOF.
While HP electrodes are simply made from pitch needle coke enabling BOF steel producers to keep virgin steel in a liquid state, UHP electrodes require much lower electrical resistivity and stronger durability. And for that, producers need petroleum needle coke.
Petroleum needle coke is produced through a manufacturing process very similar to a refinery. The production process converts decant oil, a byproduct of the gasoline refining process, into petroleum needle coke, and it generally takes two to three months to produce while the entire process from needle coke production to finished graphite electrodes for delivery to EAF producers takes about 6 months.
This is how the supply chain looks for graphite electrodes:
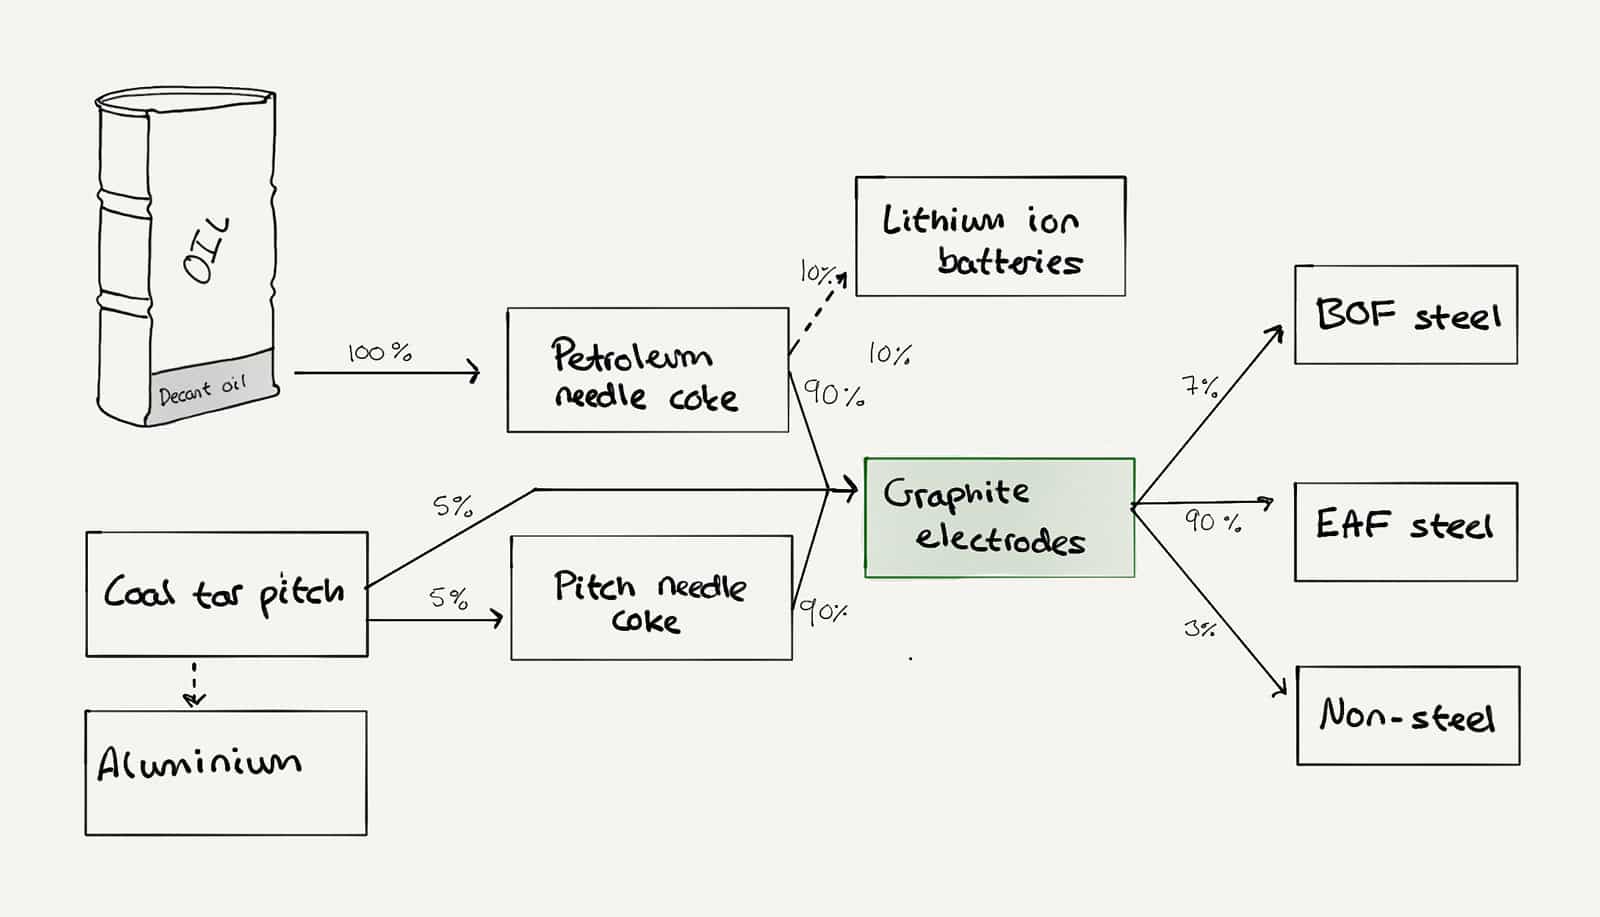
The main bottleneck that the industry faces is that the vital petroleum needle coke is becoming a scarce resource mainly due to rising demand from the other application that petroleum needle coke has: In lithium-ion batteries used in electric vehicles. And obviously, that demand is sky-rocketing.
Depending on the pricing, there could be substitution effects coming in with EV-batteries, but so far, this has brought a significant risk of tightening in industry supply of petroleum needle coke.
Since this is the main input used in the production of graphite electrodes, one would think that this is bad news for producers. But in terms of GrafTech, this seems to strengthen their competitive advantage. We’ll get back to that later.
EAFs have historically been the fastest-growing segment of the global steel industry.
Steel production is a growing market.
According to the World Streel Association, EAF steel production has grown at a rate of 3.5% per year from 1984 to 2011 while overall steel production has grown at a rate of 2.9%.
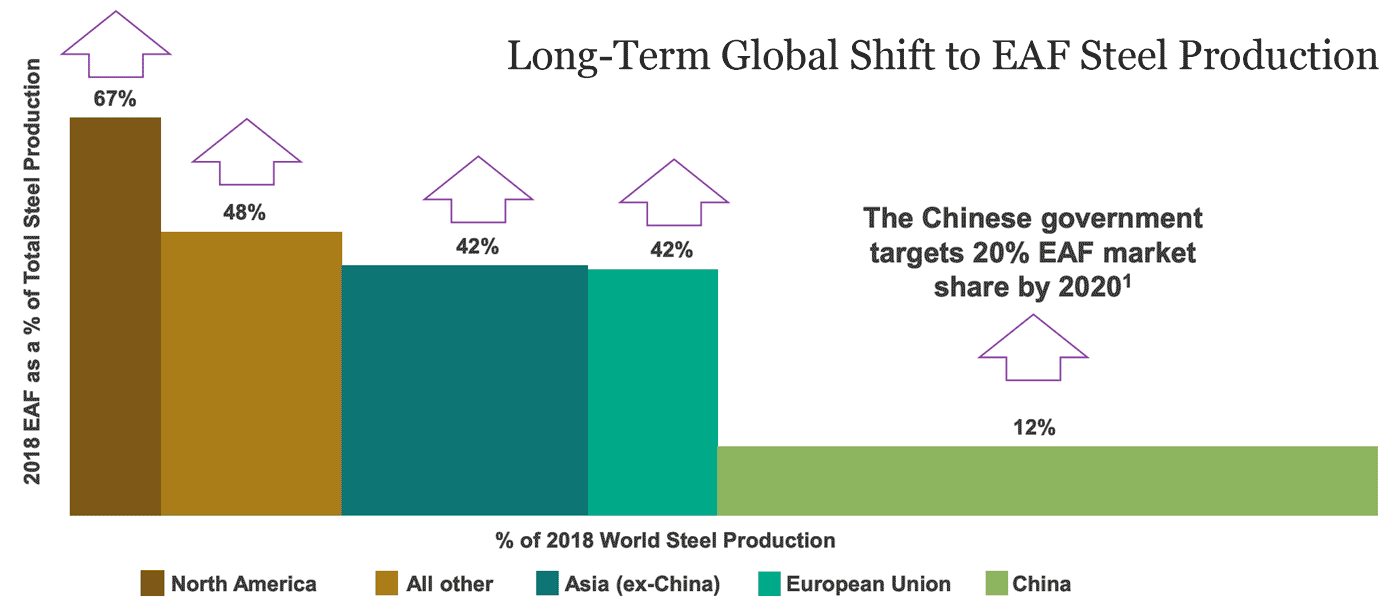
As seen, developed nations produce more steel via EAF while developing nations and emerging markets (including China) produce more steel via BOF. This basically makes sense since a bigger scrap steel base as a nation develops would make an industry switch to the more efficient EAF production method.
If we take the U.S., of which EAF steel production made up 67% of total steel production in 2018, as a proxy for the direction of global steel production, EAF would continue to grow faster than global steel production for a very long time.
Historically, Chinese steel production has been almost exclusively via the BOF method. But recently, driven by a combination of central government policies, dependable electricity, and domestic scrap steel supply, China looks to hit 20% within the next year to a total estimated EAF production level of 166 million MT steel.
Since steel production is such a vital industry for China (they currently produce 56% of the world’s steel supply), there’s a big chance that the country would want to localize all links of production and limit imports.
However, there are reasons to believe that China will not be able to swamp the graphite electrode market as they did with the steel market from 2011-2015.
Here’s why.
There are significant barriers to entry in graphite electrode and petroleum needle coke production.
Firstly, petroleum needle coke production capacity, excluding China, has remained unchanged for at least the last 10 years due to the capital intensity, technical know‐how, and long lead times required to build greenfield needle coke production facilities. Furthermore, brownfield expansion opportunities are generally not available as petroleum needle coke manufacturing is a continuous process with significant costs associated with shutting down and restarting facilities for maintenance or capital investment.
Hence, the know-how to build and run those plants is almost non-existent. The only ones who could go there would pretty much be the existent players. Meanwhile, it’s very hard to justify the capital required to enter the business with no crystal ball to tell you what the market looks like seven years down the road.
And getting into graphite electrode produce is just as hard.
According to GrafTech, the lead time from initial permitting to full production of a greenfield graphite electrode manufacturing facility would be about three to five years and would cost about $10,000 per MT. Similarly, brownfield development is complicated by significant capital costs and space and process constraints.
Only one new greenfield graphite electrode facility outside of China has been built since the 1980s and only one significant brownfield expansion has occurred. As a result of this long and uncertain time horizon to build new plants, only a few companies have the necessary technology and expertise to meet the rising demand for graphite electrodes.
But, of course, this doesn’t stop the graphite electrode industry from being very sensitive to the steel market.
Chinese steel overproduction has caused rationalization in the steel industry.
From 2011-2015, China flooded the steel market by massively increasing production capacity above demand resulting in significant excess capacity within China and increased exports into global markets.
These exports negatively affected steel prices and led EAF producers to face headwinds to reduce production. And since China ramped up production in BOF production, steel customers in the U.S. and Europe increased imports of low-cost steel products and prices for iron ore, the key material for BOFs, declined faster than scrap steel, the key material for EAFs.
While a decline in the price of oil benefited EAFs’ cost structures overall, it contributed to lower prices for petroleum needle coke and, indirectly, graphite electrodes. These factors continued to exert downward pressure throughout the EAF steel supply chain which negatively impacted financial results across the industry from 2013 to 2017.
The result was an ongoing consolidation and rationalization of graphite electrode production capacity which removed or repurposed about 20% of capacity from 2014-2016. And since it’s very hard to again build new capacity, this reduction largely represented permanent reductions.
According to GrafTech, total graphite electrode volume capacity, excluding China, declined from 1 million MT to about 800,000 MT.
Graphite electrodes saw further pricing pressure in the first half of 2016, but EAF production started to recover during the second half of 2016, which indicated a potential bottoming out in prices. Costs of the key raw materials used to run BOFs increased, and the price of scrap steel decreased, re‑balancing the economics of EAF mills relative to BOFs. World Steel Association reported a 14% increase in EAF steel production in 2017.
As profitability returned and investments in increased efficiencies ensued, total industry capacity increased to about 850,000-900,000 MT.
All the above has resulted in large price swings for graphite electrodes.
To summarize, we have talked about:
- how scarce petroleum needle coke is the primary raw material used in graphite electrodes but now experiences high demand from EV-batteries
- how industry capacity of EAF suppliers is rather fixed due to entry barriers, and
- how China has previously shocked the balance of economics for steel producers and suppliers.
All these factors have contributed to a rather volatile pricing of graphite electrodes.
While, in 2018, the 10-year average price per MT graphic electrodes was about $4,500, it fell to a historic low of $2,500 in 2016 until recently rising to a historic high of almost $10,000 on the back of renowned demand and constrained supply of petroleum needle coke.
How Does GrafTech Fit in All This?
The answer is: They fit a lot.
The graphite electrode industry is fairly consolidated with the top five players holding approximately 82% of the total capacity. The five largest producers in the industry are Showa Denko K.K., GrafTech, Graphite India Limited, Tokai Carbon Co., Ltd., and HEG Ltd.
As of 2019, GrafTech manufactured approximately 25% of the world’s graphite electrodes outside of China and owns three of the highest capacity facilities.
These three manufacturing facilities are located in the Americas and the EMEA regions, providing the company with access to low‐cost and reliable energy sources, logistical and freight advantages in sourcing raw materials and shipping graphite electrodes to over 100 global customers in those regions.
Before Brookfield took over GrafTech, they used to have six plants. Brookfield took those six plants down to three, sold off non-core assets, and focused on the core electrodes business. They inserted highly experienced management from the steel industry, honed in on a whole bunch of manufacturing efficiencies and streamlined those plants and their cost structures, achieving $100 million in cost savings.
The result was that they are now churning out more volume at their three plants than they did at the original six.
Out of the total industry capacity of 850,000-900,000 MT, excluding China, GrafTech has a current capacity of 202,000 with the ability to ramp up to 230,000 if restarting its idle St. Mary’s plant in Pennsylvania. Their currently operating graphite electrode facilities are located in Monterrey (Mexico), Pamplona (Spain), and Calais (France).
In terms of technical engineering, GrafTech’s business is complex, highly technical stuff depending on highly skilled technical and managerial personnel. There’s a large moat around the business in terms of locational advantage, a 130-year experience, proprietary know-how, trust, and quality.
While providing a somewhat commoditized product to EAFs, of which quality does matter, GrafTech also offers customers a technical service system called ArchiTech which, according to company reports, is believed to be the most advanced support and technical service platform in the graphite electrode industry enabling their engineers to work with our customers seamlessly to maximize the performance of their furnaces and provide real‐time diagnostics and troubleshooting.
These factors are all contributing to GrafTech’s stable competitive position.
However, there are two factors that are most important in giving GrafTech a durable economic moat. That is their vertical integration into petroleum needle coke and their method of contracting.
GrafTech is the only vertically integrated supplier of graphite electrodes in the world.
This is very important.
GrafTech owns and operates Seadrift Coke which is one of the world’s only standalone petroleum needle coke plants. Outside of China, there are only four petroleum needle coke producers in the world of which two are in the U.S. (one of them Seadrift in Texas) and two are in Japan.
Seadrift is the second-largest of those producers after Phillips 66 and is fully committed to supplying GrafTech’s electrode production. They provide about 70% of the petroleum needle coke needed for GrafTech’s production while the other 30% is sourced from third-party suppliers.
So since GrafTech is vertically integrated with Seadrift, the effects of huge price swings affected by both oil prices and petroleum needle coke supply and demand are rather counteracted.
This gives GrafTech a big competitive advantage since if a competitor goes bust due to a giant increase in the price of petroleum needle coke, it would decrease the supply of graphic electrodes, and GrafTech would take a greater share.
Furthermore, GrafTech’s uninterrupted, low-cost access to petroleum needle coke allows the company to operate a method of contracting that GrafTech as the only player in the industry can do.
They enter long-term agreements with customers using take-or-pay contracts.
In 2017, GrafTech reoriented its commercial strategy around a 3-5-year take‐or‐pay contract framework. Prior to that, their sales of graphite electrodes were generally negotiated annually through purchase orders on an uncontracted, nonbinding basis.
So since graphite electrode prices and constrained have become very uncertain, customers are happy to lock in their purchases to make sure they know the cost and can get a continuous supply of electrodes. This is also considering that graphite electrodes only represent between 1% and 5% of EAF production of steel.
These take-or-pay contracts are aimed to be account for about 70% of the company’s production capacity, and as of the beginning of 2020, currently signed contracts stretched until 2022. Estimated shipments and the weighted average price for these contracts amount to the following:
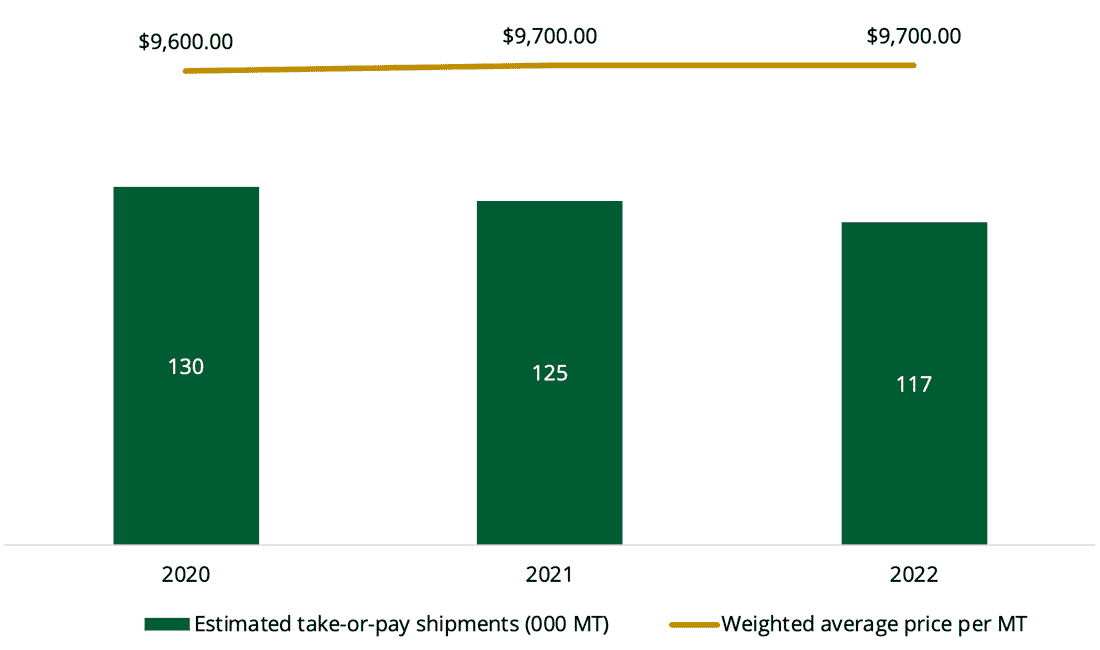
The take-or-pay contracts are largely volume-fixed and include inflation mechanisms agreed on a take-or-pay basis, where the customer is obligated to buy the agreed-upon amount or pay GrafTech to terminate the contract. These termination fees typically represent 50% to 70% of the remaining contracted revenue – a clause that adds to the certainty of future cash flows.
The Value of GrafTech
The reason why I like analyzing GrafTech is that it’s a case of very simple math, and we can pretty much know the uncertainty around that math.
To understand why that is, let’s go through the basic unit economics of GrafTech’s business.
As mentioned, because Graftech has that backward integration into petroleum needle coke, they have two advantages.
One is that they know what their costs are for several years because they have hedged decant oil, so they pretty much have a lock on their production of petroleum needle coke.
The second is that they are a low-cost producer for petroleum needle coke. So for example, if you today are a UHP producer, you would be paying about $4,500 to maybe $5,500 per MT for needle coke. In the case of GrafTech, their production cost of petroleum needle coke and everything else needed to make their electrodes amounts to about $2,750 per MT.
So, while other producers might be at maybe $6,000 or $7,000 per MT taking other production costs into account, GrafTech is at about $2,750 per MT. That’s a pretty significant delta and they have that delta for about 70% of the production.
Roughly, the company has the ability to produce 202,000 MT graphite electrodes per year, and realistically, 180,000-190,000 MT of that will be utilized. For approximately 145,000 MT of that, they have this low-cost advantage. For the rest, 35,000-45,000 MT, they don’t have this low-cost advantage.
In today’s environment, where profits are good for everyone, we can based on this knowledge make the following back-of-the-envelope calculation:
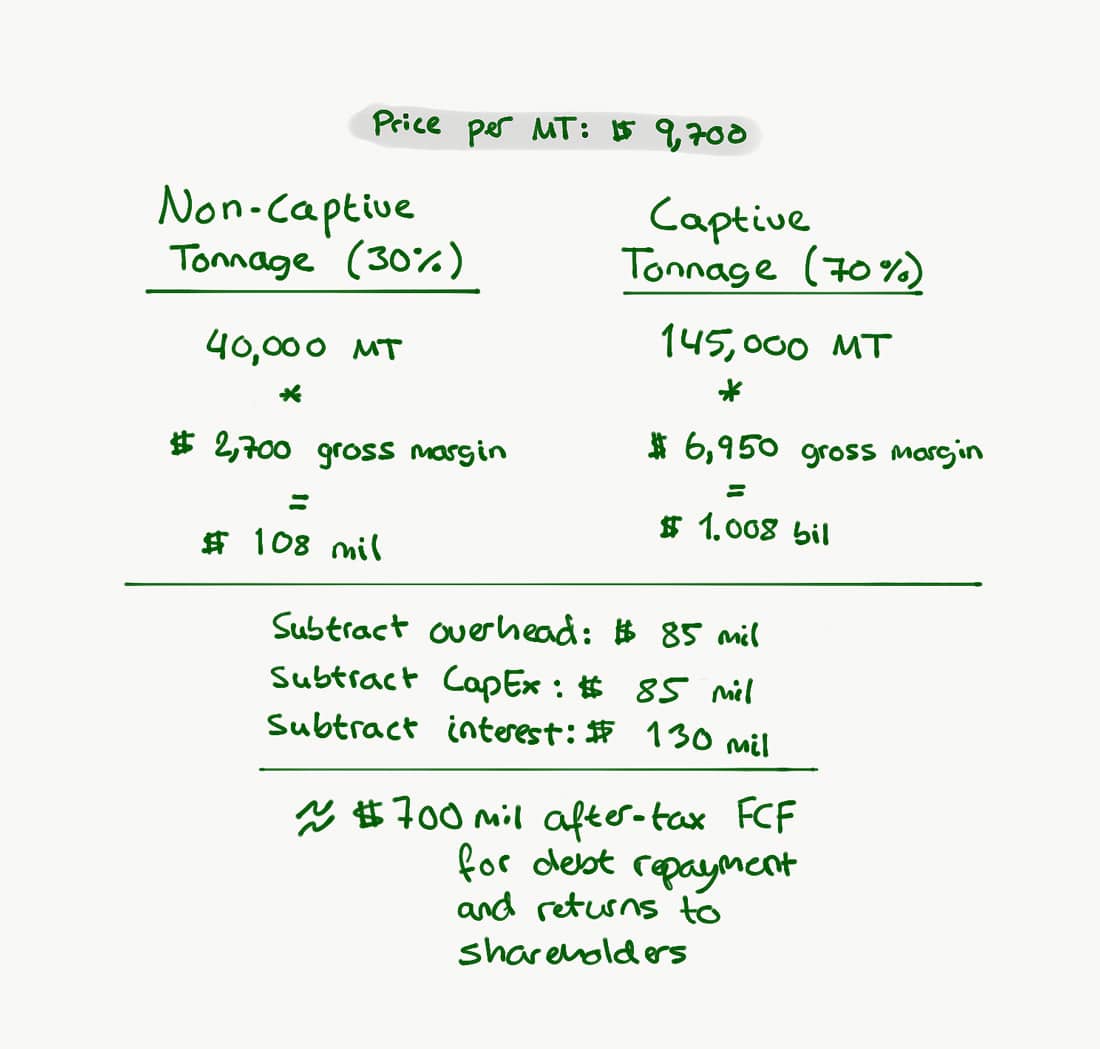
We can basically assume that GrafTech brings in a little over $100 million in gross profit from its non-captive tonnage of 30%. And for the captive tonnage, they’ve got about $1 billion in gross profit. Then we can subtract a steady $85 billion in overhead, another $85 million of CapEx, and maybe $130 million in interest expenses.
So if we take out about $300 million, plus taxes, we still have about $700 million of free cash flow coming out of the captive, and most of that amount is locked for at least three years (we have yet to get information on new contracts extending beyond 2022).
This means that their cash flows are pretty much equal to $2.1 billion over the next three years, making up about 81% of the current market cap.
And the advantage that GrafTech has in needle coke could extend well beyond three years, but you never know. We don’t know if the company will be able to secure the same type of take-or-pay contracts (and at what price) when the remaining ones expire in 2022.
That uncertainty makes it impractical for us to try and figure out the terminal intrinsic value of the business.
But we could make the following assumption.
GrafTech got a very prudent capital allocator and owner through Brookfield. Brookfield understands share buybacks very well, they understand capital allocation very well, and they own about 74% of GrafTech. Three of their guys are sitting on the board.
So, I would expect that the cash flows that come out of GrafTech in the next few years will have some efficient usage. A large part is probably going to be returned to shareholders and debt repayment because they don’t have any need for the cash unless they go to something interesting.
In 2020, the company expects that 50-60% of its cash flow will go to debt repayment with the balance going shareholder returns through dividends and share repurchases. Taking current cash flows, that’s $250-350 million.
As the stock now becomes cheaper, these buybacks become more valuable.
Say the stock remains cheap and GrafTech will earn half of what they earn now when current contracts expire. That’s about $1.75 of EPS in three years after share buybacks. At a 10x multiple (including debt reduction), it amounts to a price of $17.5 a share. Other scenarios could easily play out, but we like the probabilities at current prices.
To put if brief, the downside is quite well protected, while the upside is hard to gauge. But if you can make bets like that where you’ve covered the floor, that’s much of the battle.
So What Exactly Is the Market Missing?
There are a lot of eyes looking at GrafTech through the involvement of Brookfield, Pabrai Funds, AQR Capital Management, and Yacktman Asset Management as part of shareholders.
As investors, we need to be aware of the fact that the market is more often right than wrong in setting a price in terms of risks involved. And as for GrafTech, the perceived value has yet to crystallize. Since the company’s fixed contracting multi-year cash flows have been publicly known for over a year, what does the market really see in terms of risks and the depressed share price?
Firstly, I think that the market looks at GrafTech’s last 5 years operating results, sees disappointing average results heavily influenced by the 2011-2015 Chinese overproduction, sees the big increase in debt in 2018 (which currently stands at $1.81 billion), and concludes that the risk has increased tremendously.
But I think that is missing the stability of GrafTech’s business despite the debt overhang which doesn’t really seem extended as measured by net debt to expected cash flows.
Meanwhile, the other side of the argument of Brookfield being majority shareholders in the company is that they are currently in the process of selling some of their shares into the company’s buybacks after making at least a 5x return on their original investment of $700 million in 2015. This allows them to partly cash in while regaining stable ownership due to share count reduction.
Of course, when the market sees this, it adds temporary downward pressure on the share price which, I believe, is what we’re seeing now.
Additionally, a risk for minority shareholders could be that GrafTech would be taken private again at a depressed price or sold to another entity. But I find that scenario rather unlikely given that the crystallization of GrafTech’s value would probably arrive faster in the public market.
Other risks include the inherent cyclicality of the steel industry, the relatively small capitalization of EAF, the sustainability of EAF’s current high levels of profitability, and the potential threat from Chinese competitors.
Obviously, these are not small risks. So there certainly are scenarios under which we can lose money on GrafTech. There are scenarios under which GrafTech can go to zero. There are many things that can happen which can destroy the thesis.
But it doesn’t mean it’s a bad investment.
The GrafTech bet is a game of probabilities, and as long as we have done our homework and tried to assess the probabilities correctly, we can assess the risk-reward. One can’t always tell the score by what’s on the board. One has to go deeper than that.
And that’s why we added GrafTech International to the Junto portfolio.
Conclusion
My purpose in buying GrafTech International with a value investment thesis is quite peculiar since I am not able to forecast the prospects of the business out to more than 3 years.
In this case, I did not attempt to calculate a terminal intrinsic value of the business since I did not have to. The information at hand was enough to determine that the current price of GrafTech provides a sufficient margin of safety.
And as for a price target, I don’t have one. We’ll see how the business and market progress over the next couple of years and act accordingly.
To conclude, at current prices, I surely believe GrafTech is a great case of Mohnish Pabrai’s:
“Heads I win, tails I don’t lose much”.