FactSet is a nimble and simple business.
There’s really not much to not like about the company – except that I don’t use their services myself. So I surely have a handicap in making an assessment of the business in that regard.
This is a bit of a lengthy write-up. I knew very little about FactSet before I sat down to study the business. But I very much enjoyed learning about it. Hence, in line with what we do at Junto – learn – what you’re about to read is basically a put-together of my learning notes on FactSet.
So, to go right ahead, we’ll now try to break down the fundamentals of FactSet, the company’s place in the financial world, and its intrinsic value through the lens of unit economics.
Data, Data, Data
Institutional finance has experienced an explosion in the usage and manipulation of data over the past decades. And because investment management is a competitive industry fighting for assets under management, getting the correct amount of information delivered in the correct format is an important part of decision making.
Founded in 1978 by two Wall Street colleagues, Howard Wille and Charles Snyder, FactSet has worked hard at servicing this vital industry need for 40 years.
With solid industry experience, the two founders saw opportunities to expand the use of financial analysis within the financial world by taking advantage of the rapid evolution of computer technology in the late 1970s.
With an urge to take advantage of such opportunities, Wille and Snyder quit their jobs to found a two-person business providing financial information. By aggregating raw data from providers and structuring the information for their users, FactSet began by offering simple four-page business analysis reports. These reports were named “Company FactSet” and were delivered to customers in physical form, often by means of bike messengers.
Back then, customers would usually buy raw data themselves from smaller third-party providers such as Compustat and then hire an internal or external programmer to make the data usable for their investment managers. FactSet’s services enabled them to save this cumbersome – and more expensive – process. Using FactSet’s product, customers could lower their costs and make their work processes more efficient which is still the pillar of FactSet’s selling proposition.
Of course, things have changed a bit since then. Information accessibility has become instant, whether it’s on a computer, tablet, or smartphone, and the amount of data has become abundant. What matters now is how that data is manipulated and delivered through proprietary – and resilient – technology.
FactSet has surfed this wave quite well delivering steady revenue growth for 39 consecutive years and growth in income for 23 years. They caught the wave of their industry early on and stayed on it stubbornly throughout the years by keeping on the edge of innovation. It was a good call Wille and Snyder made in 1978.
FactSet now serves more than 5,600 clients with 128,000 users with some of the largest clients being Bank of America Merrill Lynch, Wells Fargo, and PNC. In 2019, they added 432 net new clients and 34,925 net new users. The company is led by Philip Snow as CEO, who joined the company in 1996 and took the chief executive position in 2015, and Philip Hadley, who joined in 1985 and has been chairman since 2000.
To best understand FactSet’s business and value, I think it makes sense to take the following steps:
First, we take a top-down view starting with the industry perspective and FactSet’s competitive position. Then, we dive into the details of the business. Lastly, we look at the unit economics of FactSet as a subscription business to ultimately approximate the intrinsic value of the company.
Let’s dive in.
A Winner Take Most Industry
Like with a lot of software subscription niches, the financial information service industry has a lot going for it, including fixed development costs and large economies of scale in deployment and servicing. Add that to lock-in effects of customers due to effects of ecosystems, high barriers to entry, pricing power, and high switching costs, and the financial information service industry thus naturally tends toward a concentrated “winner take most” industry.
Of course, this is evident with Bloomberg undeniably being the juggernaut with a 30% market share. The market challenger is Refinitiv (formerly a department with Thompson Reuters) with about 20% market share, and FactSet itself is a smaller player with 5% on the sideline with the largely similar solution, CapitalIQ. Other competitors include online database suppliers and integrators and their applications, such as MSCI, Morningstar, RIMES Technologies, and thousands of micro data providers, including FactSet’s own data vendors.
Basically, these companies are all somewhere between being software and media businesses. And usually due to high costs per user, clients – whether buy-side or sell-side – pick one solution.
However, all these solutions are not homogenous. There are areas where they are roughly the same and there are areas where they differ immensely. Essentially, the stickiness of a certain platform is pretty much dependent on the different use of purposes by different pockets of the industry.
Bloomberg is the indisputable leader within equity research and fixed income with buy-side clients. And because the buy-side ultimately pays for everything else in the financial industry, they have a certain power to dictate what everyone else uses for research, analysis, and especially communication. This is excruciatingly hard to compete with. However, with great features comes great complexity. And that might not be the main attraction for investment professionals searching for ease-of-use and comparable solutions at only the fraction of the price of a Bloomberg Terminal annual subscription of $24,000. A full product subscription of FactSet stands at an annual $12,000.
For example, investment bankers might place higher utility on click-through functionality, ease of formatting, assistance in building pitch books, etc. This is the stronger side of solutions such as FactSet and CapitalIQ.
Because of this heterogeneity of industry supply, it’s why I like to term the market as a “winner take most” and not “winner take all”. Such industries can at times provide plenty of profits for everyone as long as the market acts rationally.
And so far, that has been the case with financial information service providers.
Details of the Business
All the following calculations and figures have been structured and composed using the ROIQ model – a powerful tool to analyze and compare financial statements efficiently.
FactSet earns its revenue by selling its data solutions (both sourced in-house and from third parties), applications, and services as subscriptions.
As of the end of 2019, those subscriptions for the next 12 months amounted to just under $1.5 billion excluding a small amount of professional service fees the company earns in addition to subscriptions.
The company’s typical clients are within buy-side capital management. Solutions to such clients include historical financial information, industry information, financial estimates, access to third-party research, conference call transcripts, news feeds, and so on. Buy-side clients currently account for more than 80% of the yearly contract value.
The rest comes from sell-side clients such as research firms, consulting firms, investment banks, and larger corporations wishing a look-through insight into their own industry and practices.
Collectively, for the past five years, FactSet has shown steady, medium to high single-digit top-line growth rates:
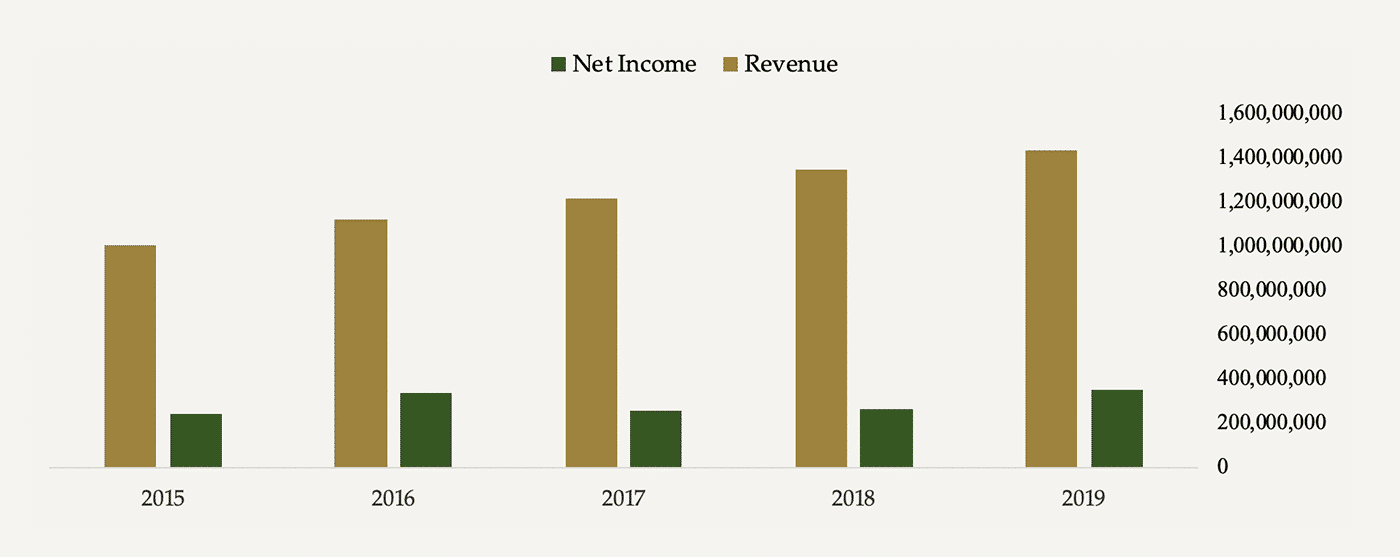
The majority of this growth is attributable to the company’s Analytics, Wealth, and Content & Technology Solutions divisions which collectively make up about 60% of FactSet’s yearly contract values. These divisions grew respectively by 7%, 10%, and 15% organically in 2019.
The remaining Research division makes up a bit over 40% of the yearly contract values and grows by low single-digits annually. However, it’s important not to assume that this division is a less vital division because it basically lays the foundation for the other divisions’ services. Its main purpose is to focus on company analyses, idea generation, and research management using the company’s proprietary data.
Despite increased cost-focus at existing clients, FactSet has shown a great ability to win over more and bigger clients and users over the years. Especially so in Asia in which the AsiaPac segment currently comprises 10% of FactSet’s contract value with attractive room for expansion.
Of course, Asian capital markets are less mature than in North America, which together with South and Latin America make up about 60% of the company’s contract value. This geographic segment grew by 5% in 2019.
FactSet is essentially a software business in a steadily growing market. And with profitable software businesses come attractive software margins and very capital-light operations. Take a look at FactSet’s profitability measures and returns on capital:
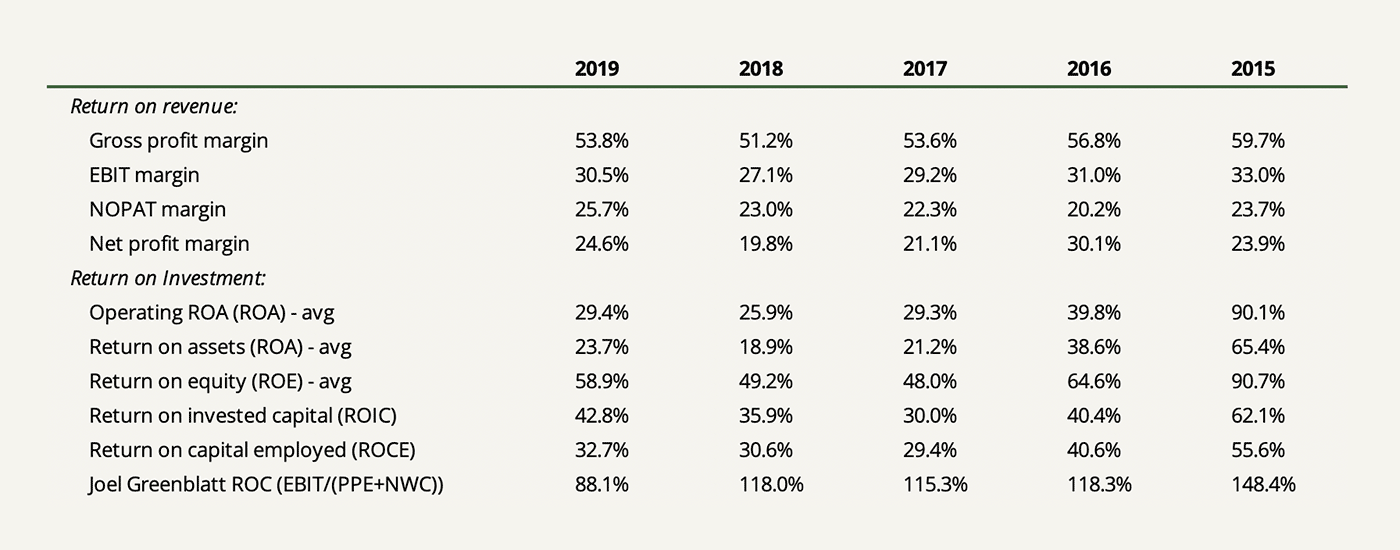
These returns, and their stability, are quite impressive.
Of course, those are abnormal returns and are surely why the price of the company is currently trading at 16 times price-to-book. What we want to figure out is if this abnormal level of profitability can continue going forward.
Let’s continue.
Pretty much all income is translated into cash with little reinvestment in capital expenditures.
Here’s net income compared to cash flow measures over the past five years:
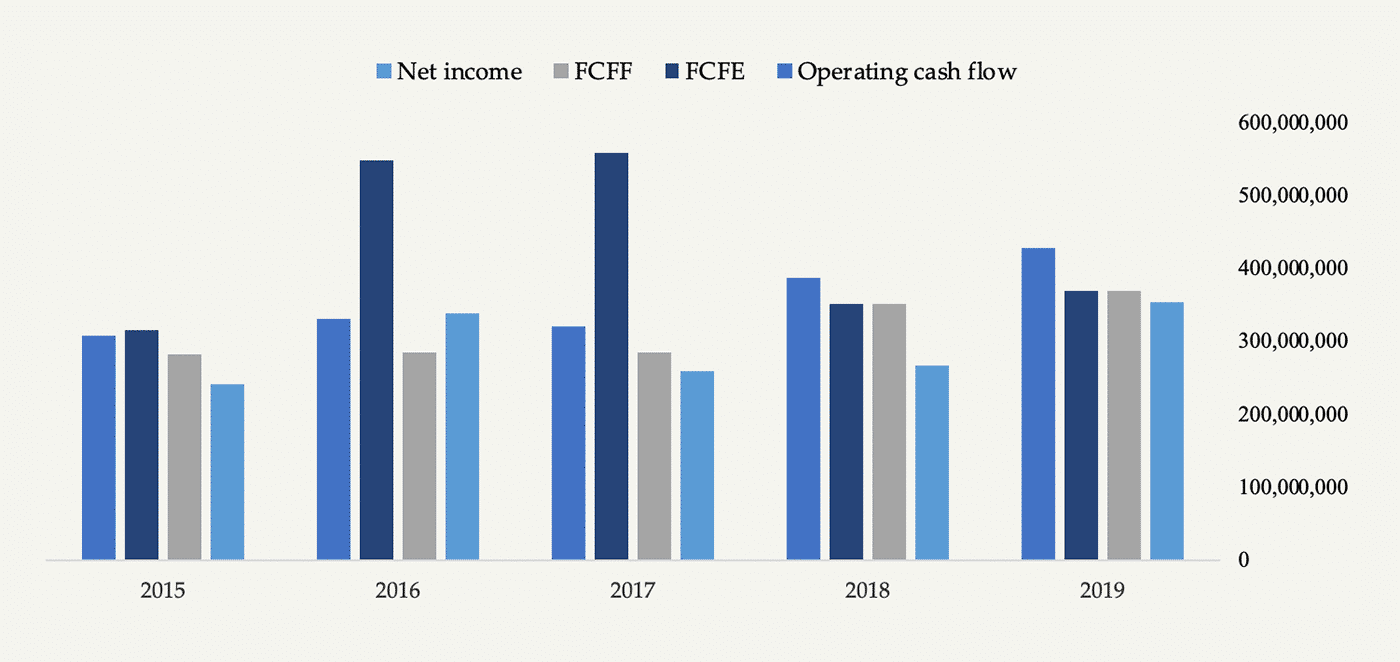
According to my assessment, maintenance capital expenditures in infrastructure, server equipment for data centers, computers, and so on amount to about a conservative (as in high) figure of $50 million. This translates into an owner earnings figure that aligns very closely with net income of about $350 million.
And with other software businesses, growing that income invites significant advantage of scale. Of course, the nature of FactSet and its competitors requires costs related to high service levels and consultancy work to educate and retain clients, but a business built around information and internet-based solutions involves great opportunities for much improved margins as sales rise.
So how about future growth?
Management sees good opportunities for creating future growth in the mid to high single-digit range towards 2022. But to drive that growth, investments are planned to increase automation and data collection.
As the company writes in the annual report:
“Over the next three years, we plan to accelerate our investments to increase the breadth and depth of our content and enhance our technology—with the goal of driving higher top-line growth at scale—while also implementing further cost reductions and increasing productivity to support that scale.”
These announced investments will probably put a little pressure on operating margins toward 2022.
Meanwhile, management places a high emphasis on opportunities to expand market share within the Wealth division. FactSet has a relatively small market share here but has for the past years experienced high growth, much assisted by its won contract with Bank of America Merrill Lynch’s over 15,000 wealth advisors in 2018. Bank of America Merrill Lynch is the largest supplier of wealth management in the U.S. which gives rise to FactSet’s ability to expand in that area.
Furthermore, FactSet’s planned investments are to be spent in offering better applications that clients can match with their internal systems (APIs), move to the cloud, and increase the salesforce.
I find great confidence in management’s ability to crystallize these growth prospects reaching beyond 2022. There really is nothing to complain about in terms of management’s level of skill in operations, communication with shareholders, and a healthy balance sheet. This has resulted in a historically stable business and will probably continue to do so.
In terms of payout policy, the company paid out $100 million in dividends and spent $113 million on buybacks in 2019. The dividend has steadily increased for the past 14 years and average annual buybacks for the past five years has been $208 million. Of course, this is a large part of operating cash flows and the business can afford it. It goes to show that FactSet’s business doesn’t need much capital to grow other than investing in continuing operating costs.
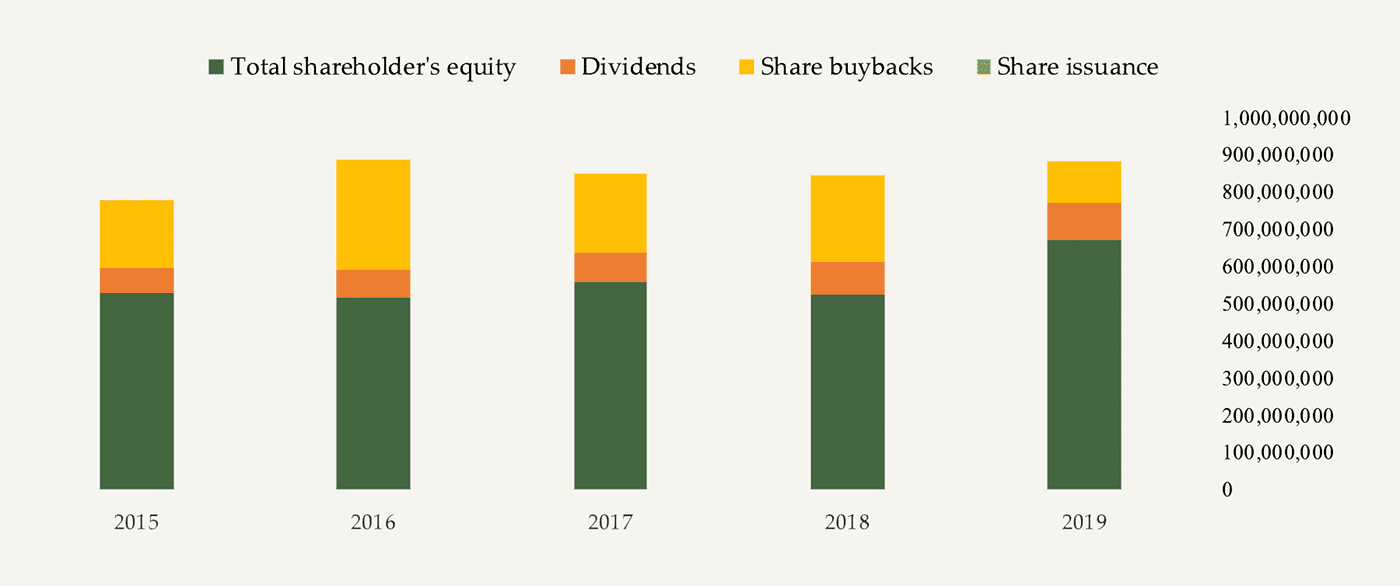
I like looking at the amount of buybacks a company makes from year to year in relation to the share price to gauge where management might find its own shares undervalued – that is assuming management is sensible and rational about it. Buybacks can be hugely beneficial to shareholders if shares are bought back at the right price, but detrimental if bought at too high a price.
As seen above, FactSet about halved its yearly spend on buybacks while the price increased from $200 per share to $267 during 2019. Cash on hand increased to $360 million. This might be to either allow room for said technology investments or due to too high a price.
Risks of the Business
I see three main risks to FactSet’s business.
Rise of passive investing
The financial information industry is under pressure from consolidation within the asset management world, where the increasing share of passive investments has squeezed the earnings of asset managers and thus increased their focus on reducing costs.
I think it’s a good thing for the world that the rise of passive investing has squeezed a lot of wretched excess and non-transparency out of investment management. But, of course, it doesn’t come without risks. Systemic failures and misallocation of capital might be some of the bi-products of passive investing, depending on how large it’s growing. But still, millions of savers are better off this way.
However, for services such as FactSet’s or Bloomberg’s, because of such developments I really can’t with certainty know how the industry will look in 10 or 20 years.
There are quite a few dynamics that are affected by this trend. Some include:
- Squeezes on management and performance fees at buy-side clients might lead to an increased focus on reducing their costs.
- Retail investors, pension funds, and endowments might increasingly lose faith in active investment management as index funds consistently show to perform better. Redemptions might be the result. As said, over 80% of FactSet’s clients are buy-side.
- If clients increasingly jump on automation, they will probably continue to reduce headcount. Since FactSet’s solutions are priced on a per-user basis, this might in the long run lead to a restructuring of how products are priced through e.g. enterprise-wide custom pricing based on data load.
Of course, data solutions are not going away. But I do think there’s an evident risk to some slice of the pie being taken away, whether it’s margins, size of the market, or through competitive dynamics.
Sensitivity to market movements
The profitability and management fees of buy-side clients are significantly tied to assets under management. A market decline or increased volatility not only depresses the value of assets under management but might also cause a significant increase in redemptions, further reducing assets under management and new client creation.
On the contrary, such scenarios might actually also turn to an advantage if such asset management clients decide to switch from Bloomberg to FactSet or other lower-priced solutions.
Easy access to data
When FactSet was founded in 1978, financial data was scarce. Today, data is largely abundant and much easier accessible at a low cost.
Bill Gates once said in a 1992 interview:
“Supply is the killer of value. That’s why the computer industry is such a strange industry. We’re dealing with amazing increases in supply.”
Gathering, cleaning, and sorting the data is, of course, another matter. Gathering data is not like exclusively pumping oil out of the ground or mining gold as the only operator in a specific geographic location.
Data is omnipresent and pretty much available to all that are willing to pay for it and work with it. FactSet itself aggregates data and content from over 1,000 third-party data suppliers, news sources, exchanges, brokers, and contributors into their own service.
What I mean is that pretty much all proprietary data offerings do tend to depreciate over time. Eventually, all unique data sets become commoditized, and this is one of FactSet’s bigger threats to its competitiveness.
But then, this now leads to the following question:
What is the degree of scarcity that allows businesses such as FactSet to create value out of the use of data and continuously earn high returns on capital doing so?
FactSet’s Economic Moat
The answer to the above question comes from, I believe, the following factors that are contributing to the scarcity of FactSet’s solutions:
- proprietary technology,
- breath of interlinked products,
- the resilience of the product, and
- the user experience.
Without proprietary technology, few software firms would have any competitive advantage.
For FactSet, the embedded nature and modularity of its product offering is such proprietary technology. For example, a key contributor to FactSet’s economic moat includes that of their portfolio attribution and analytics models that really are helping the company grow in the Wealth space setting its solutions apart from competitors with a significantly high barrier to entry.
Much of such proprietary technology has evolved over the years through in-house research and development and much has grown through acquisitions. Management seems fully aware of this fact. For the last three years, the company has spent a total of $647 million on research and $560 million on acquisitions (Vermilion, BISAM, and Interactive Data Managed) in 2016 and 2017 subsequent to Philip Snow becoming CEO in 2015.
FactSet does not have a separate R&D department. Rather, its product development and engineering departments work closely with their strategists, product managers, sales, and other client-facing specialists to identify areas of improvement. FactSet has made focus on R&D a simple given in day-to-day operations through constant improvement and has not spun it off to some separate department. This is a great way to stay on the forefront of innovation and in line with client demands.
In addition to in-house R&D, I also believe FactSet will continue making acquisitions to increase the breadth of its intellectual property.
While such acquisitions should be allocated to accumulating proprietary data sets, a higher priority should be placed on acquiring proprietary technology. Like when the company in 2015 acquired Code Red for $36 million. Code Red serves as an analyst CRM system that allows research departments to collaborate and share existing research and notes while monitoring employee workflow. Such developments help expand FactSet’s economic moat but, of course, it also adds uncertainty to how skilled management is in capital allocation. Debt has significantly increased during the company’s acquisition spree in 2016 and 2017, although still at a very sustainable level.
The last factor includes that of trust. Data is a sensitive area, especially when it’s misleading. FactSet clients trust that the information they gather to lead to important decisions is correct and fully updated.
What do these factors lead to?
High switching costs and loyalty.
The proof is in the pudding: FactSet has been able to retain about 95 percent of annual contract values each year with about a 90 percent user retention rate.
This shows product stickiness and gives us valuable input into now looking at the unit economics of the business.
FactSet’s Unit Economics
One can’t and shouldn’t look at a subscription business without thinking about the unit economics of that business. With subscription business models, you can’t understand its intrinsic value by looking at just one month or even a few months since it’s the discounted future cash flows of lifetime value that matter.
Here’s my attempt to apply that principle to FactSet.
But first, what is meant by unit economics?
It’s the profitability of a business specifically studied and expressed on a per-unit basis. In FactSet’s case, that means on a single client – or subscriber – basis. From there, we view the unit economics as building blocks to determine the aggregate intrinsic value of the company.
By this method, we don’t violate the valuation first principle of value being all future incoming and outgoing cash flows discounted at an appropriate rate of interest over the remaining life of the asset. We just disaggregate the cash flows into units that the company generates revenue from.
Think of a subscription as an annuity. Subscriptions require a customer acquisition cost upfront while the subsequent revenue profile consists of a stream of incoming cash flows. But unlike annuities, subscriptions are more subject to risk and uncertainty.
In every revenue period, some clients might drop off while others remain and new clients join. Some subscribers require a higher cost to acquire than others. And then there’s pricing power or pressure which might affect the revenue per client.
From this, we can derive that the key inputs into a valuation model based on the unit economics of FactSet consist of the following:
- The average revenue per client (ARPU)
- The client retention rate
- The growth rate in revenue per existing client
- The operating expenses for:
- servicing existing clients
- corporate expenses
- getting new clients (CAC)
- The growth rate in net new clients
- A discount rate
What’s important to understand about these inputs is that they are related and might feed back on each other. They are assumptions that are dynamic and will inevitably change.
Nevertheless, what I found particularly pleasing about looking at FactSet’s unit economics is that we pretty much know the right figures for all inputs but the composition of operating expenses. But, while FactSet already knows all the correct inputs into its unit economics calculation, we have to make assumptions about what we can’t know.
Average revenue per client (ARPU)
We take FactSet’s total annual subscription value of $1.48 billion as a proxy for the current subscriber base and divide it by the number of clients, not users. Why? Because the retention rate is directly related to clients and a single client might have thousands of users.
To simplify, we also add FactSet’s annual income from professional service fees which are not included in its annual subscription value. These fees amount to $23 million.
$1,503 million / 5,574 clients (end of 2019) = $269,645
This is equal to a little over 20 users per client.
Obviously, some cohort analysis could be done to dig into this matter a little further. I would guess that FactSet’s client base to some degree follows a sort of power law with some very large clients and a large number of small clients. This might have an effect on the retention rate within each cohort. But we have to work with what we’ve got.
Client retention rate
We take the multi-year average retention rate of 90% which is equal to a churn of 10%. In terms of customer lifetime, this equals an average subscription period of 10 years.
Growth rate in revenue per existing client
We also must think about the growth of existing clients due to either price increases, cross-selling of additional services, or increases in the number of users (workstations) with each client. Since we know that the annual dollar retention rate is 95%, this gives us a growth rate for existing clients of:
95% / 90% – 1 = 5.56%
Now, if we remember from our risk section, there is some probability that clients will want to reduce headcount (users) as the investment management industry increasingly moves toward passive investing. Can we, therefore, expect such a growth rate for existing clients in the long run? That’s hard to tell and something we must be aware of when assessing the sensitivity of our valuation.
Operating expenses
Here comes the tricky part.
Remember that FactSet itself already knows the exact proportion of what operating expenses are spent on what while we have to guess.
What we want is to break down total operating expenses into servicing existing clients, corporate expenses, and getting new clients (the customer acquisition cost).
According to the income statement, FactSet’s operating expenses consist of service costs and SG&A.
Service costs include that of content collection, consulting, product development, data costs, maintenance, depreciation, and so on. We can fairly assume that these are the costs required to service existing users.
The 2019 gross margin was 53.8%. But as said, the company plans on investing in automation and technology toward 2022, so let’s adjust it down to 51% in this period. After 2022, we assume gross margin to remain at 53.8%.
For 2020, we can therefore estimate total service costs to be:
$1,503 million * (1 – 0.51) = $736.47 million
That’s equal to service costs of $132,126 per client.
Next, the annual report states the following about SG&A:
“Selling, general and administrative expenses include compensation for the sales and various other support and administrative departments in addition to travel and entertainment expenses, marketing costs, rent, amortization of leasehold improvements, depreciation of furniture and fixtures, office expenses, professional fees and other miscellaneous expenses.”
Now, what proportion is spent on corporate expenses, and what proportion is spent on getting new clients?
Given FactSet’s very capital-light business and operating efficiency, I would venture to guess that corporate expenses comprise about 10% of total operating expenses with the remaining being spent on getting new clients. Out of the total 2019 operating expenses of about $1 billion, corporate expenses thus comprised $100 million of that. Let’s assume that these corporate expenses grow by 4% a year.
If we now take out those $100 million of the company’s 2019 SG&A, we get $234 million left for new client acquisition. Based on a 90% retention rate and since we know that the company added 432 net new clients during 2019 (up from 5,142), we can estimate a gross client addition of 946. Thus, we get $247,357 per client in CAC.
Growth rate in net new clients
During fiscal years of 2019, 2018, and 2017, FactSet added net new clients (after churn) with a growth rate of 8.4%, 8.4%, and 12.8%, respectively. We assume that the company will be able to grow net new clients at a rate of 8% over the next 10 years which will then drop to 2%.
Valuation
We can now build our valuation model on the sum of the three components derived from the work of Prof. Aswath Damodaran:
Enterprise value = Value of existing clients + Value added by new clients – Value drag from corporate expenses
Let’s take each component separately.
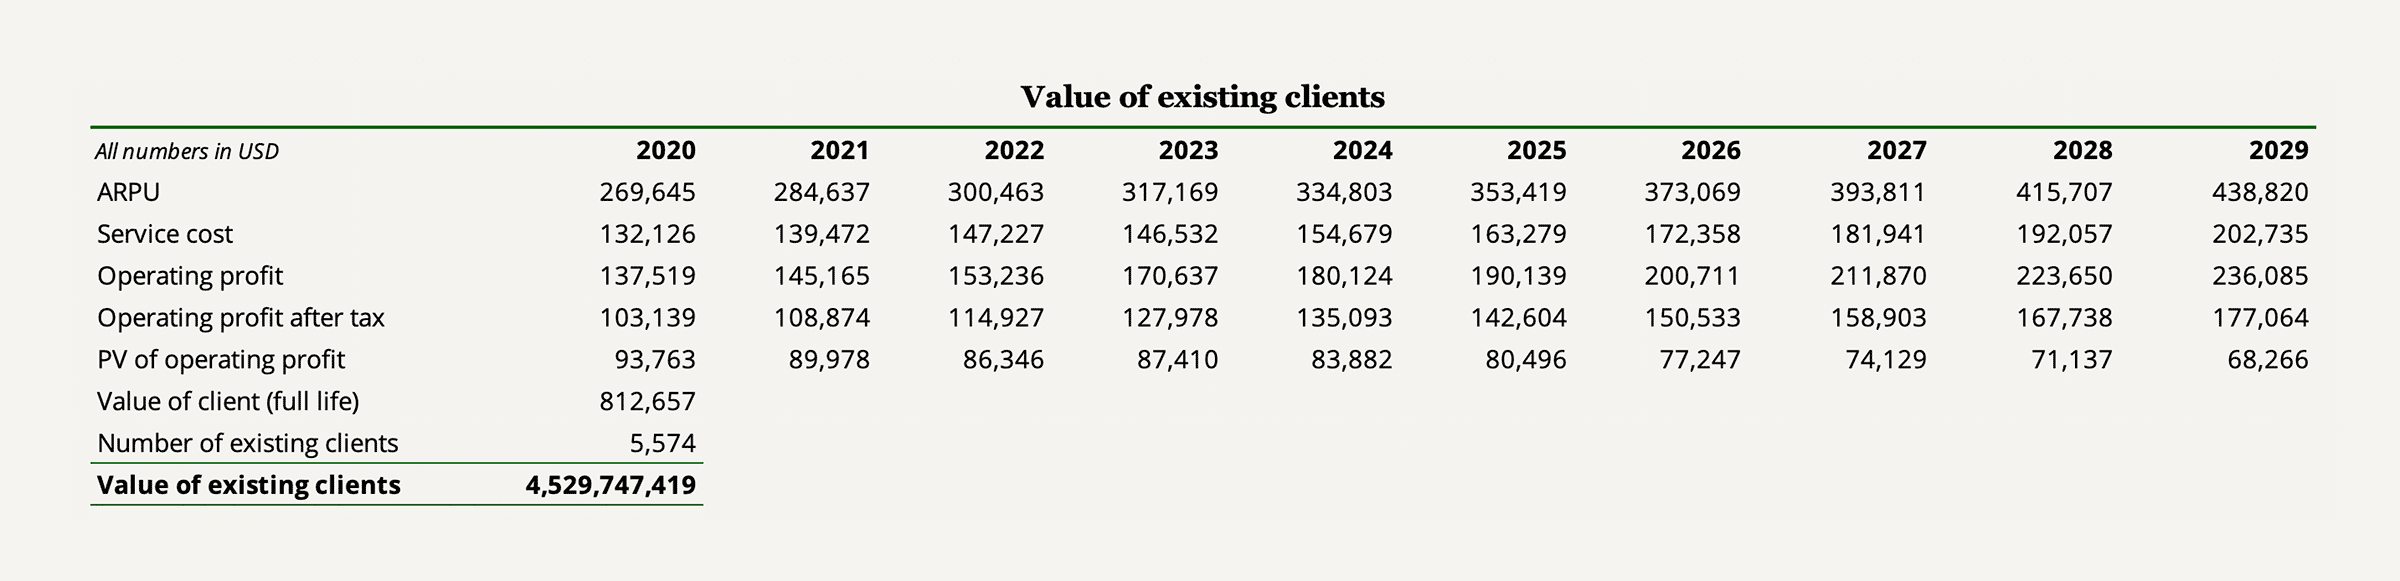
Valuing existing users
Summary of main assumptions:
- Growth rate in ARPU: 5.56%
- Gross margin 2020-2022: 51%
- Terminal gross margin: 53.8%
- International tax rate: 25%
- Cost of capital: 10%
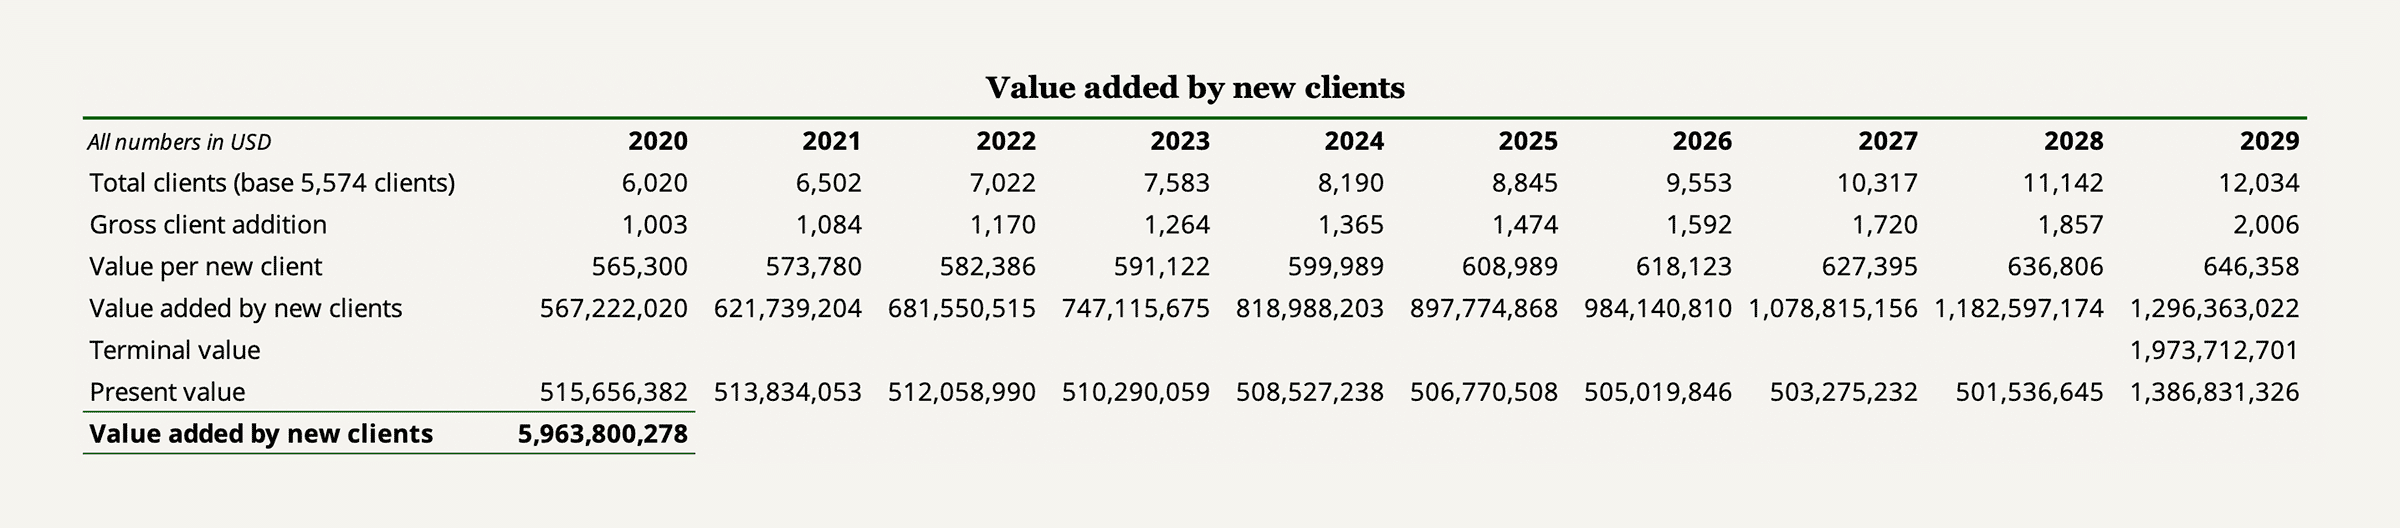
Value added by new clients
Summary of main assumptions:
- Net client addition growth rate 2020-2029: 8%
- Terminal net client addition growth rate: 2%
- Growth rate in value per new client: 1.5% (inflation)
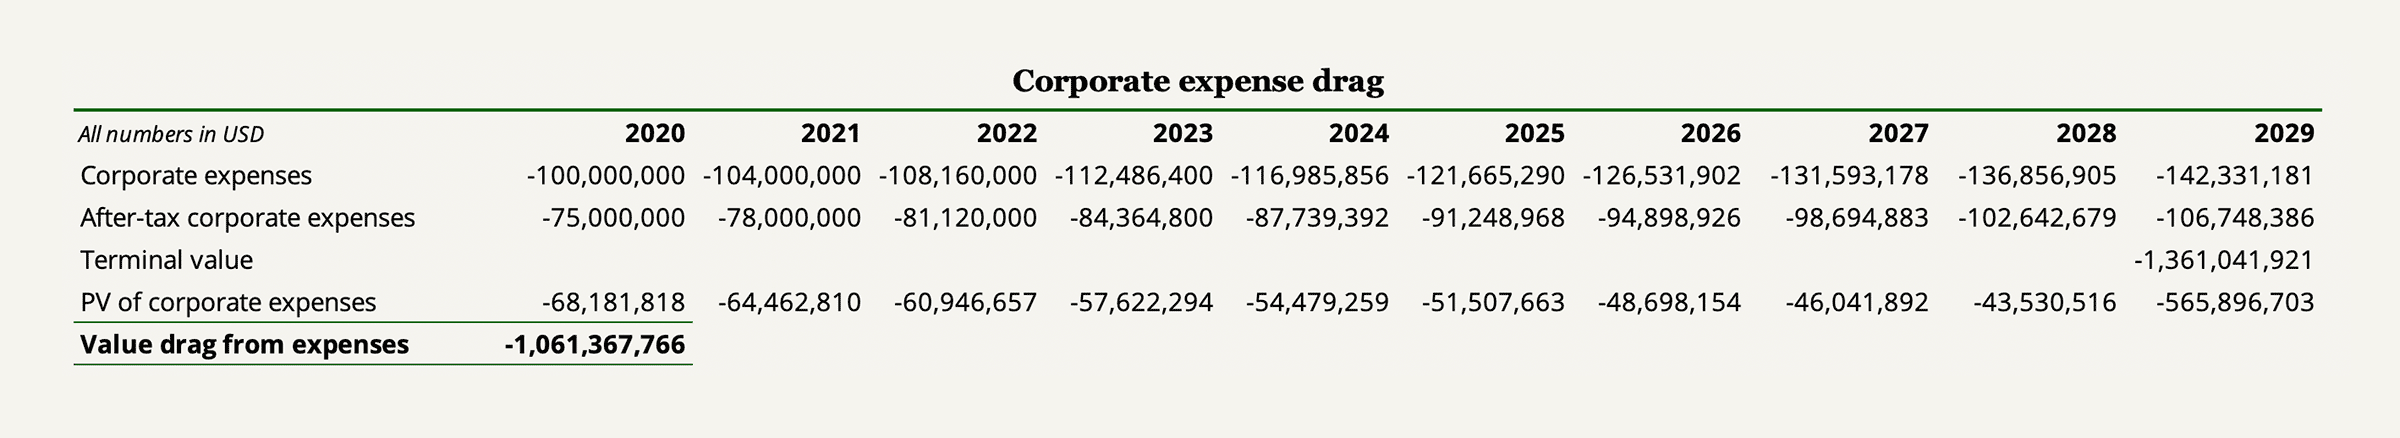
Value drag from corporate expenses
Summary of main assumptions:
- Corporate expenses growth rate: 4%
- International tax rate: 25%
FactSet’s value of equity
Bringing together all three components, we get a value for FactSet’s operating assets of about $9.4 billion.
To now arrive at the value of equity, we add cash and equivalents and subtract debt and capitalized lease obligations:
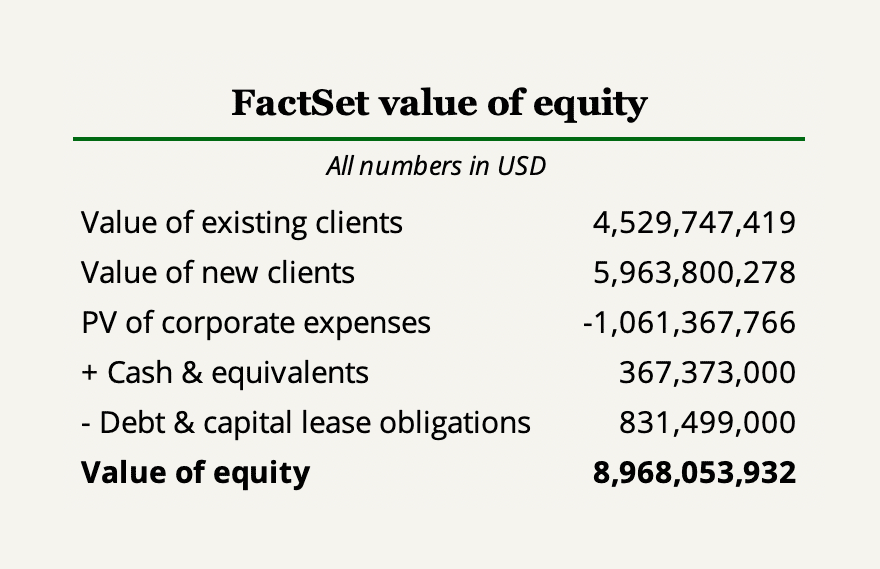
Finally, we arrive at an intrinsic value estimate of around $9 billion. Meanwhile, as of writing this write-up, FactSet is priced at $11.6 billion which suggests a rich price.
***
What we must now ask ourselves is: Are we satisfied with this valuation?
Well, not fully.
You might find it convincing reading it, but you might also have noticed that valuing FactSet on a disaggregated basis invites much more flexibility in the assumptions that we have to make. If we compare a disaggregated valuation to a simple discounted cash flow model in aggregated form, we discover that the work we have to do is more involved and complex.
The problem is that it’s rather difficult to look at a business from the outside and determine each nut and bolt of its unit economics. Of course, understanding unit economics in subscription businesses is enormously important because we want to know the right questions to ask. But we can never understand it fully unless we’re on the inside.
Indeed, I think that if a manager of FactSet was to look at this valuation, he would disagree with many of the assumptions made. No question about it.
So what are we to do?
Well, one thing that’s sensible is to compare our estimate with a simple discounted cash flow valuation.
We’re now in luck since we already used the ROIQ model to make our entire analysis and reclassification of the financial statements preceding the valuation. Therefore, we can simply play around with the numbers in the simple discounted cash flow model to assess our intrinsic value on an aggregated basis.
As previously mentioned, FactSet’s owner earnings align closely with the company’s annual net income of about $350 million because pretty much all income is converted to cash. To be exact, my owner earnings estimate for 2019 is $372 million.
If we simply assume that these owner earnings will grow at 12% annually to account for new client additions and growth in revenue from existing clients, then assume a terminal growth of 2%, and we again discount the cash flows with a 10% required rate of return, we arrive at an intrinsic value of $10.35 billion. Higher than our previous estimate but still lower than the current market capitalization.
Ending Remark
My initial decision to dive into learning about FactSet’s business turned out to be a lengthy case study on valuation. If you stuck all the way to this end, I hope you, like me, have learned a bunch.
In terms of FactSet as an investment, I started out this write-up writing that it’s a simple and nimble business. It’s also a great business that I wish was cheaper.
But the question is: Is recurring revenue with low year-to-year fluctuations really ever going to be cheap?